Some recent studies:
Realistic Spin Model for Multiferroic NiI2, Xuanyi Li, Changsong Xu, Boyu Liu, Xueyang Li, L. Bellaiche, and Hongjun Xiang, Physical Review Letters 131, 036701 (2023); DOI: 10.1103/PhysRevLett.131.036701
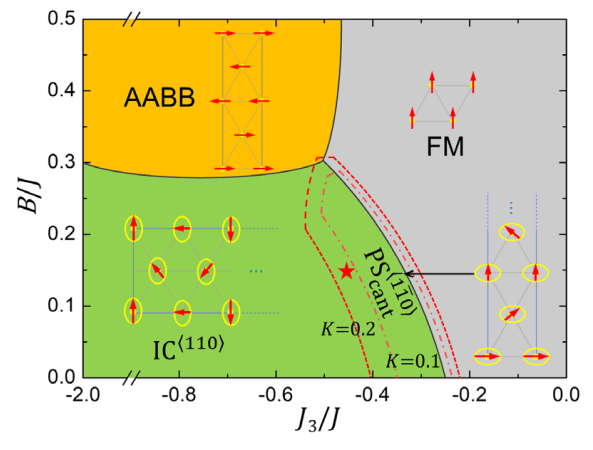
A realistic first-principle-based spin Hamiltonian is constructed for the type-II multiferroic NiI2, using a symmetry-adapted cluster expansion method. Besides single ion anisotropy and isotropic Heisenberg terms, this model further includes the Kitaev interaction and a biquadratic term, and can well reproduce striking features of the experimental helical ground state, that are, e.g., a proper screw state, canting of rotation plane, propagation direction, and period.
Ferroelectric solitons crafted in epitaxial bismuth ferrite superlattices, Vivasha Govinden, Peiran Tong, Xiangwei Guo, Qi Zhang, Sukriti Mantri, Mohammad Moein Seyfouri, Sergei Prokhorenko, Yousra Nahas, Yongjun Wu, Laurent Bellaiche, Tulai Sun, He Tian, Zijian Hong, Nagarajan Valanoor and Daniel Sando, Nature Communications 14, 4178 (2023); https://doi.org/10.1038/s41467-023-39841-3
we present evidence for ferroelectric solitons in (BiFeO3)/(SrTiO3) superlattices.
Hexagonal Close-packed Skyrmion Lattice in Ultrathin Ferroelectric PbTiO3 Films, Shuai Yuan, Zuhuang Chen, Sergei Prokhorenko, Yousra Nahas, Laurent Bellaiche, Chenhan Liu, Bin Xu, Lang Chen, Sujit Das, Lane W. Martin, Physical Review Letters 130, 226801 (2023); DOI: 10.1103/PhysRevLett.130.226801
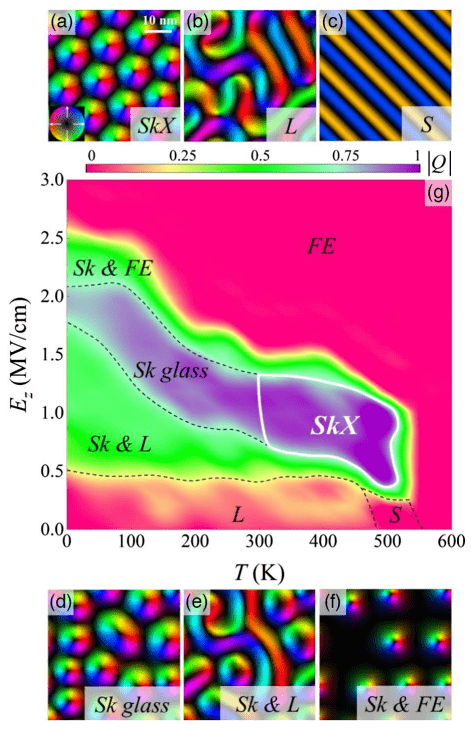
Using phase-field and effective Hamiltonian simulations, the evolution of polar topology and the emergence of a phase transition to a hexagonal close-packed skyrmion lattice is explored through the construction of a temperature-electric field phase diagram for ultrathin ferroelectric PbTiO3 films.
Spherical Ferroelectric Solitons, Vivasha Govinden, Sergei Prokhorenko, Qi Zhang, Suyash Rijal, Yousra Nahas, Laurent Bellaiche and Nagarajan Valanoor, Nature Materials 22, 553-561 (2023). https://doi.org/10.1038/s41563-023-01527-y
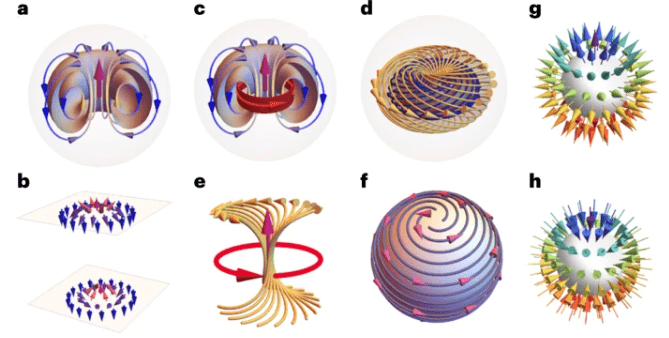
Spherical ferroelectric domains, such as electrical bubbles, polar skyrmion bubbles and hopfions, share a single and unique feature—their homogeneously polarized cores are surrounded by a vortex ring of polarization whose outer shells form a spherical domain boundary. The resulting polar texture, typical of three-dimensional topological solitons, has an entirely new local symmetry characterized by a high polarization and strain gradients. Consequently, spherical domains represent a different material system of their own with emergent properties drastically different from that of their surrounding medium. Examples of new functionalities inherent to spherical domains include chirality, optical response, negative capacitance and giant electromechanical response. These characteristics, particularly given that the domains naturally have an ultrafine scale, offer new opportunities in high-density and low-energy nanoelectronic technologies. This Perspective gives an insight into the complex polar structure and physical origin of these spherical domains, which facilitates the understanding and development of spherical domains for device applications.
Zeeman effect in centrosymmetric antiferromagnetic semiconductors controlled by an electric field, Hong Jian Zhao, Xinran Liu, Yanchao Wang, Yurong Yang, Laurent Bellaiche and Yanming Ma, Physical Review Letters 129, 187602 (2022); DOI: 10.1103/PhysRevLett.129.187602
we propose a paradigm to harness electronic spin in centrosymmetric antiferromagnets via Zeeman spin splitting of electronic energy levels — termed as the spin Zeeman effect —which is controlled by an electric field.
Topology turns the crank on magnetoelectric switch, Wei Ren and Laurent Bellaiche, Nature 607, 35 (2022). https://doi.org/10.1038/d41586-022-01786-w
NEWS AND VIEWS
06 July 2022Ponet, L., Artyukhin, S., Kain, T. et al. Topologically protected magnetoelectric switching in a multiferroic. Nature 607, 81–85 (2022). https://doi.org/10.1038/s41586-022-04851-6
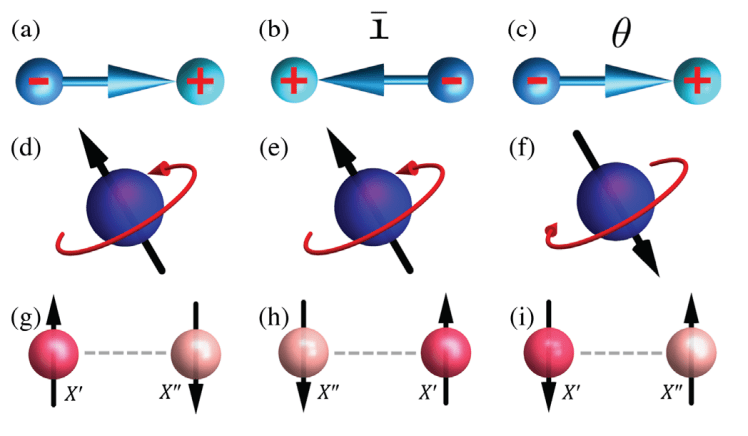
A mechanism resembling a crankshaft switches the electric polarization of a material in response to changes in an applied magnetic field. The resulting four-state switch is linked to the material’s intriguing topology.
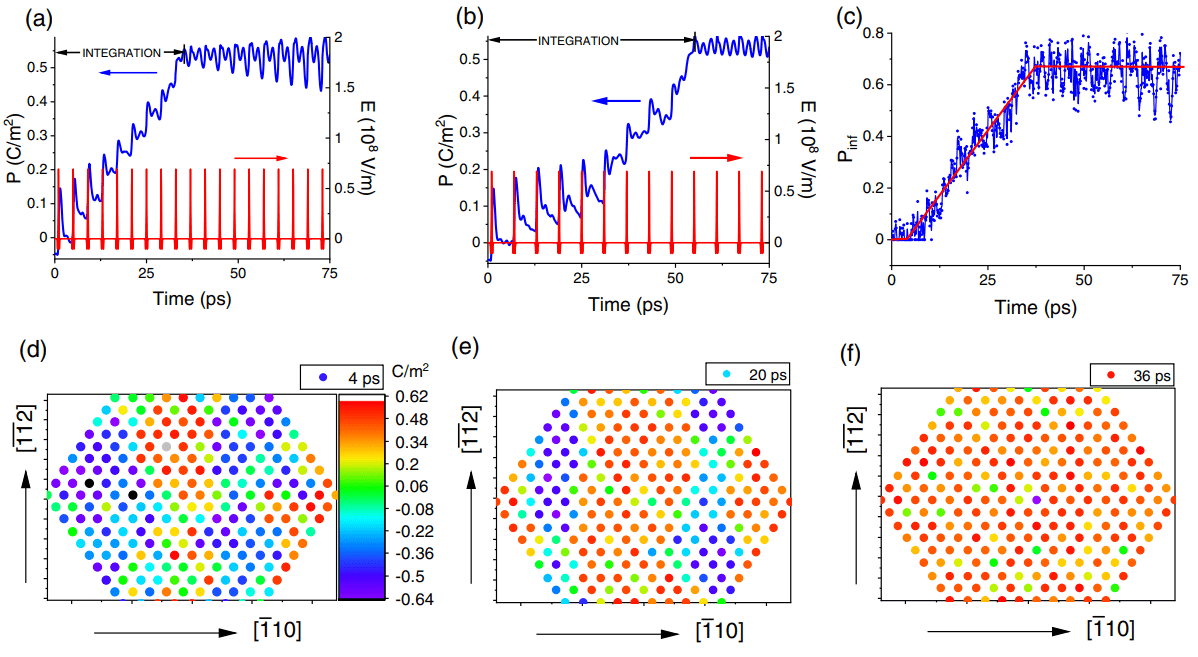
Deterministic control of ferroelectric polarization by ultrafast laser pulses, Peng Chen, Charles Paillard, Hong Jian Zhao, Jorge Íñiguez, and L. Bellaiche, Nature Communications 13, 2566 (2022); https://doi.org/10.1038/s41467-022-30324-5
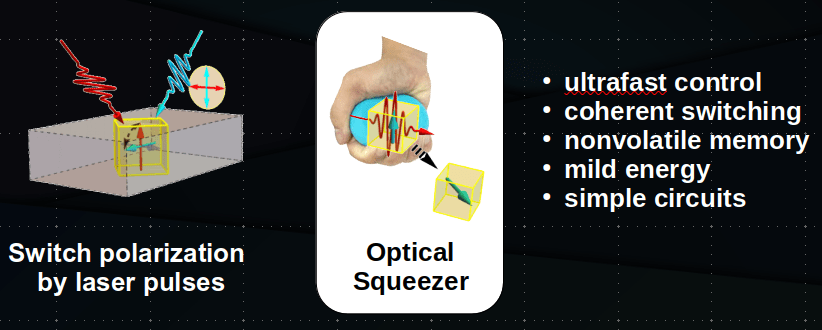
Ultrafast light-matter interactions present a promising route to control ferroelectric polarization at room temperature, which is an exciting idea for designing novel ferroelectric-based devices. One emergent light-induced technique for controlling polarization consists in anharmonically driving a high-frequency phonon mode through its coupling to the polarization. A step towards such control has been recently accomplished, but the polarization has been reported to be only partially reversed and for a short lapse of time. Such transient partial reversal is not currently understood, and it is presently unclear if full control of polarization, by, e.g., fully reversing it or even making it adopt different directions (thus inducing structural phase transitions), can be achieved by activating the high-frequency phonon mode via terahertz pulse stimuli. Here, by means of realistic simulations of a prototypical ferroelectric, we reveal and explain (1) why a transient partial reversal has been observed, and (2) how to deterministically control the ferroelectric polarization thanks to these stimuli. Such results can provide guidance for realizing original ultrafast optoferroic devices.
High-density switchable skyrmion-like polar nanodomains integrated on silicon, Lu Han, Christopher Addiego, Sergei Prokhorenko, Meiyu Wang, Hanyu Fu, Yousra Nahas, Xingxu Yan, Songhua Cai, Tianqi Wei, Yanhan Fang, Huazhan Liu, Dianxiang Ji, Wei Guo, Zhengbin Gu, Yurong Yang, Peng Wang, Laurent Bellaiche, Yanfeng Chen, Di Wu, Yuefeng Nie and Xiaoqing Pan, Nature 603, 7899 (2022); https://doi.org/10.1038/s41586-021-04338-w
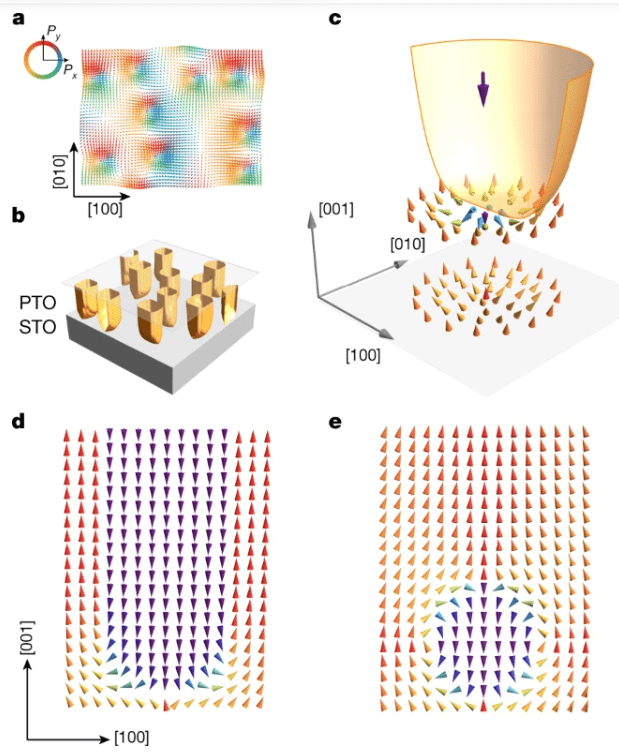
we report the realization of room-temperature skyrmion-like polar nanodomains in lead titanate/strontium titanate bilayers transferred onto silicon. Moreover, an external electric field can reversibly switch these nanodomains into the other type of polar texture, which substantially modifies their resistive behaviours. The polar-configuration-modulated resistance is ascribed to the distinct band bending and charge carrier distribution in the core of the two types of polar texture. The integration of high-density (more than 200 gigabits per square inch) switchable skyrmion-like polar nanodomains on silicon may enable non-volatile memory applications using topological polar structures in oxides.
Magnetization compensation temperature and frustration-induced topological defects in ferrimagnetic anti-perovskite Mn4N, Temuujin Bayaraa, Changsong Xu, and L. Bellaiche, Physical Review Letters 127, 217204 (2021); https://doi.org/10.1103/PhysRevLett.127.217204.
First-principles-based simulations are conducted to investigate magnetic properties and topological spin textures in the antiperovskite Mn4N ferrimagnet. A magnetization compensation temperature, resulting from a competition between different Mn sublattices, is found in this system, when under thermal equilibrium. Striking metastable topological states are also discovered, including nanometric hedgehog-antihedgehog pairs that originate from frustrated exchange interactions rather than the usual Dzyaloshinskii-Moriya interaction.
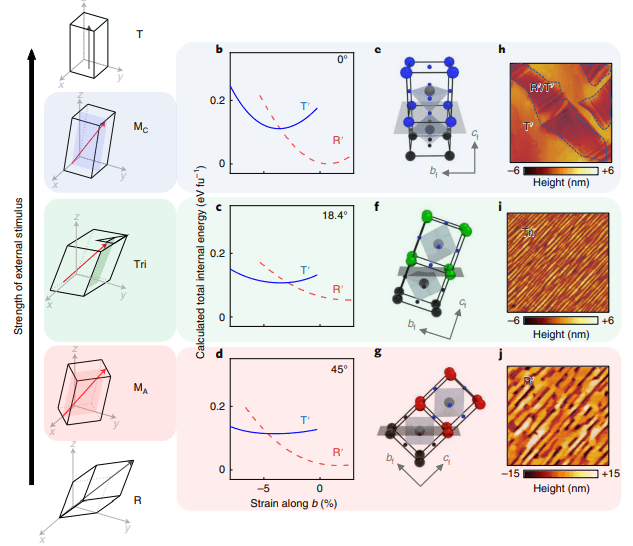
Anisotropic epitaxial stabilization of a low-symmetry ferroelectric with enhanced electromechanical response, Oliver Paull, Changsong Xu, Xuan Cheng, Yangyang Zhang, Bin Xu, Kyle P. Kelley, Alex de Marco, Rama K. Vasudevan, Laurent Bellaiche, Valanoor Nagarajan and Daniel Sando, Nature Materials (2021); https://doi.org/10.1038/s41563-021-01098-w
we use epitaxial strain and orientation engineering in tandem—anisotropic epitaxy—to craft a low-symmetry phase of BiFeO3 that acts as a structural bridge between the rhombohedral-like and tetragonal-like polymorphs.
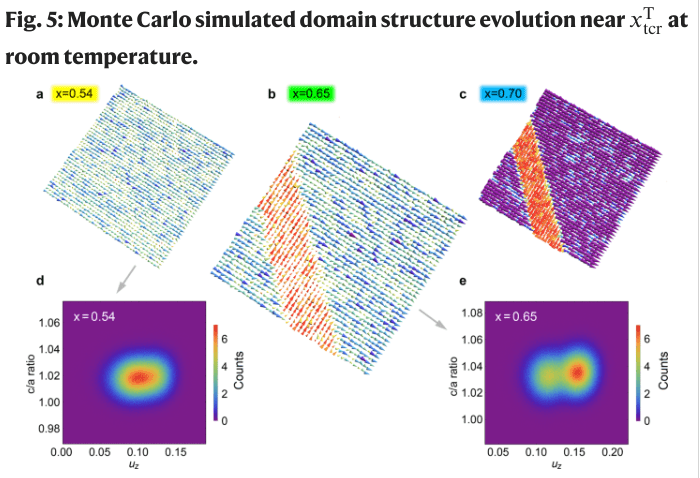
Ferroelectric phase-transition frustration near a tricritical composition point, Xian-Kui Wei, S. Prokhorenko, Bi-Xia Wang, Zenghui Liu, Yu-Juan Xie, Yousra Nahas, Chun-Lin Jia, Rafal E. Dunin-Borkowski, Joachim Mayer, Laurent Bellaiche and Zuo-Guang Ye, Nature Communications 12, 5322 (2021); https://doi.org/10.1038/s41467-021-25543-1.
we report discovery of phase-transition frustration near a tricritical composition point in ferroelectric Pb(Zr1-xTix)O3.
“Ultrafast Neuromorphic Dynamics Using Hidden Phases in the Prototype of Relaxor Ferroelectrics,” Sergey Prosandeev, Julie Grollier, Diyar Talbayev, Brahim Dkhil and L. Bellaiche, Physical Review Letters 126, 027602 (2021). DOI: https://doi.org/10.1103/PhysRevLett.126.027602
Materials possessing multiple states are promising to emulate synaptic and neuronic behaviors. Their operation frequency, typically in or below the GHz range, however, limits the speed of neuromorphic computing. Ultrafast THz electric field excitation has been employed to induce nonequilibrium states of matter, called hidden phases in oxides. One may wonder if there are systems for which THz pulses can generate neuronic and synaptic behavior, via the creation of hidden phases. Using atomistic simulations, we discover that relaxor ferroelectrics can emulate all the key neuronic and memristive synaptic features. Their occurrence originates from the activation of many hidden phases of polarization order, resulting from the response of nanoregions to THz pulses. Such phases further possess different dielectric constants, which is also promising for memcapacitor devices.
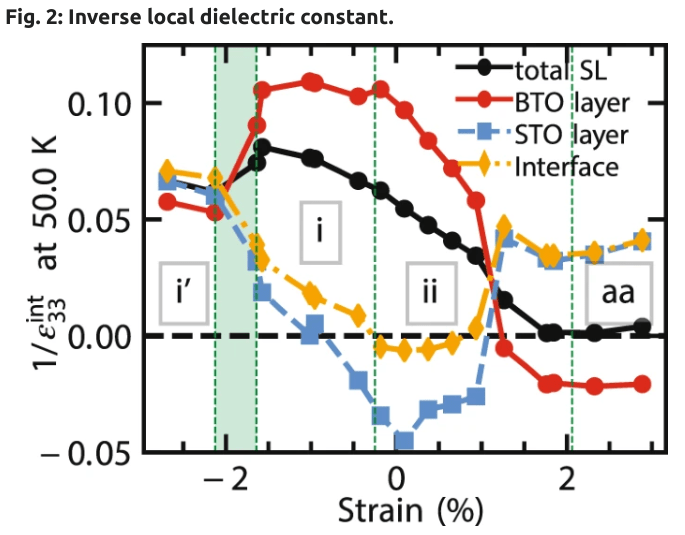
“Strain Control of Layer-Resolved Negative Capacitance in Superlattices,” Raymond Walter, Charles Paillard, Sergey Prosandeev and L. Bellaiche, npj computational materials 6, 186 (2020); https://doi.org/10.1038/s41524-020-00459-4
Negative capacitance in BaTiO3/SrTiO3 superlattices is investigated by Monte Carlo simulations in an atomistic effective Hamiltonian model, using fluctuation formulas for responses to the local macroscopic field that incorporates depolarizing fields. We show that epitaxial strain can tune the negative capacitance of the BaTiO3 ferroelectric layer and the overall capacitance of the system. In addition, we predict and explain an original switching of the negative capacitance from the BaTiO3 layer to the SrTiO3 layer at low temperatures for intermediate strains.
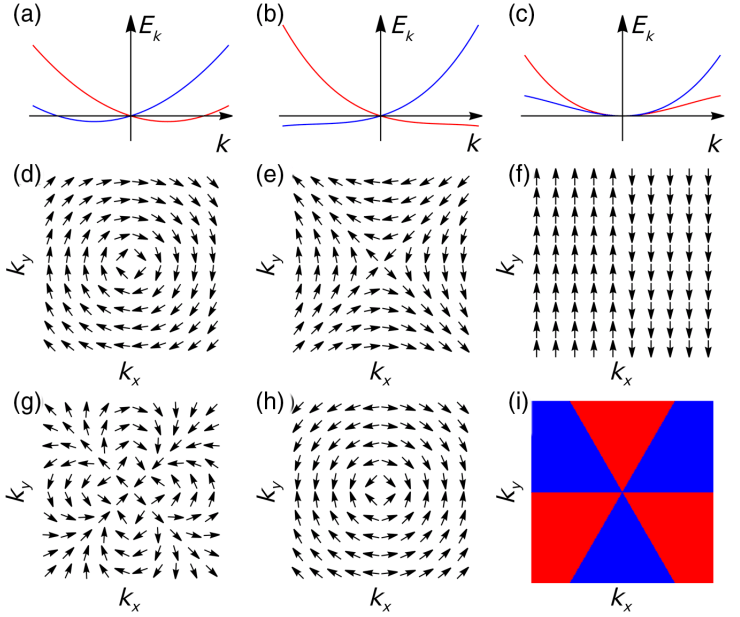
“Purely Cubic Spin Splittings with Persistent Spin Textures,” H. J. Zhao, H. Nakamura, R. Arras, C. Paillard, P. Chen, J. Gosteau, X. Li, Y. Yang, and L. Bellaiche, Physical Review Letters 125, 216405 (2020). DOI: https://doi.org/10.1103/PhysRevLett.125.216405
Purely cubic spin splittings in the band structure of bulk insulators have not been extensively investigated yet despite the fact that they may pave the way for novel spin-orbitronic applications and can also result in a variety of promising spin phenomena. By symmetry analysis and first-principles simulations, we report symmetry-enforced purely cubic spin splittings (SEPCSS) that can even lead to persistent spin textures. In particular, these SEPCSS can be thought to be complementary to the cubic Rashba and cubic Dresselhaus types of spin splittings.
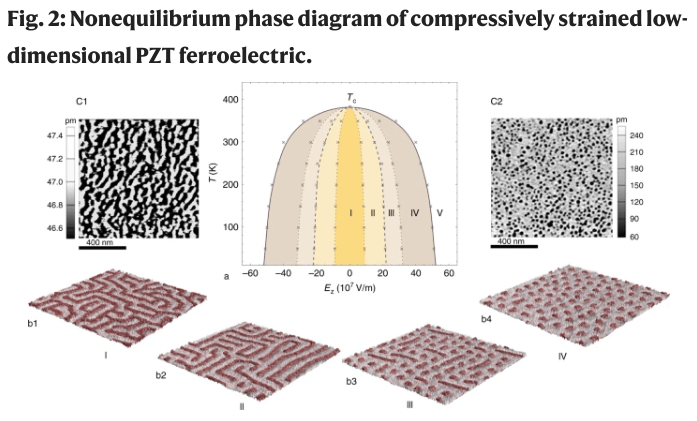
“Topology and control of self-assembled domain patterns in low-dimensional ferroelectrics,” Y. Nahas, S. Prokhorenko, Q. Zhang, V. Govinden, N. Valanoor and L. Bellaiche, Nature Communications 11, 5779 (2020). https://doi.org/10.1038/s41467-020-19519-w
Whilst often discussed as non-trivial phases of low-dimensional ferroelectrics, modulated polar phases such as the dipolar maze and the nano-bubble state have been appraised as essentially distinct. Here we emphasize their topological nature and show that these self-patterned polar states, but also additional mesophases such as the disconnected labyrinthine phase and the mixed bimeron-skyrmion phase, can be fathomed in their plurality through the unifying canvas of phase separation kinetics. Under compressive strain, varying the control parameter, i.e., the external electric field, conditions the nonequilibrium self-assembly of domains, and bridges nucleation and spinodal decomposition via the sequential onset of topological transitions. The evolutive topology of these polar textures is driven by the (re)combination of the elementary topological defects, merons and antimerons, into a plethora of composite topological defects such as the fourfold junctions, the bimeron and the target skyrmion. Moreover, we demonstrate that these manipulable defects are stable at room temperature and feature enhanced functionalities, appealing for devising future topological-based nanoelectronics.
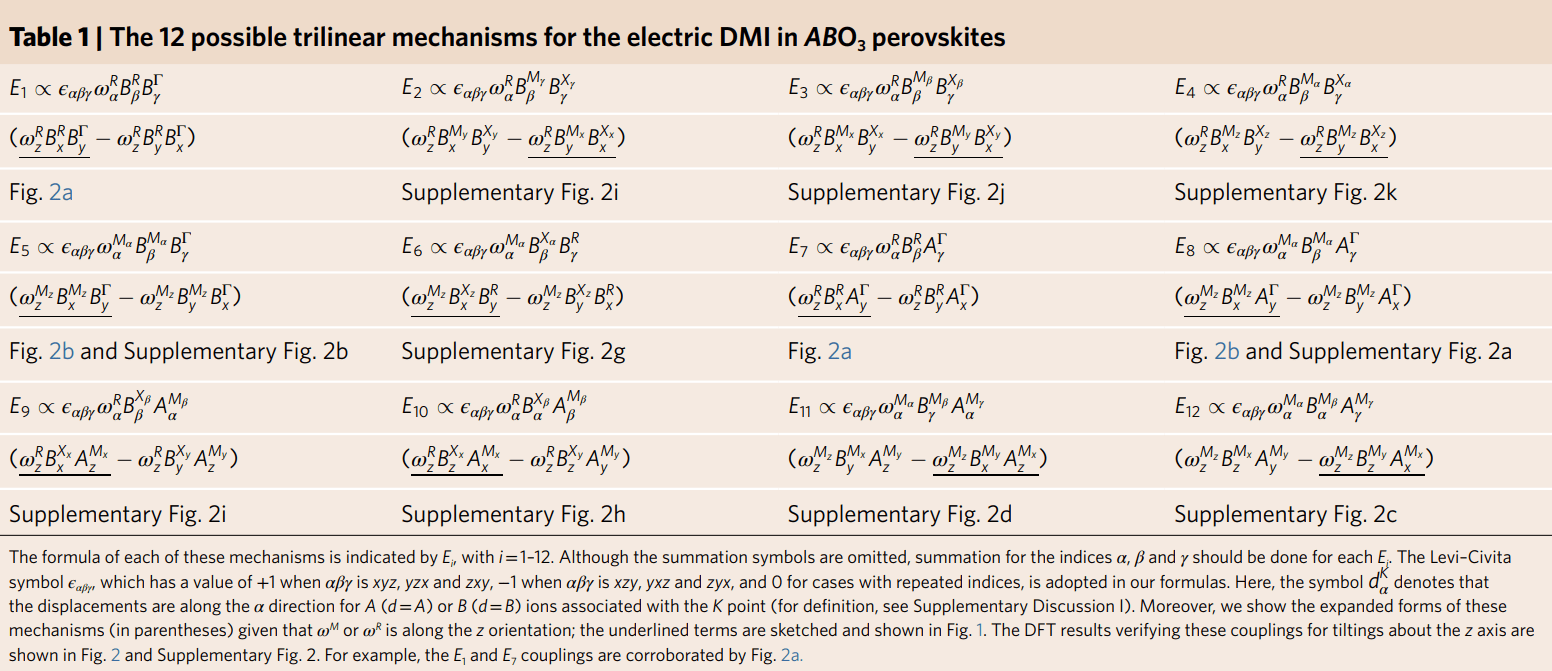
“Dzyaloshinskii-Moriya-like interaction in ferroelectrics and anti-ferroelectrics,” Hong Jian Zhao, Peng Chen, Sergey Prosandeev, Sergey Artyukhin, and Laurent Bellaiche, Nature Materials (2020); https://doi.org/10.1038/s41563-020-00821-3
The Dzyaloshinskii–Moriya interaction (DMI) between two magnetic moments mi and mj is of the form D𝑖𝑗⋅(m𝑖×m𝑗). It originates from spin–orbit coupling, and is at the heart of fascinating phenomena involving non-collinear magnetism, such as magnetic topological defects (for example, skyrmions) as well as spin–orbit torques and magnetically driven ferroelectricity, that are of significant fundamental and technological interest. In sharp contrast, its electric counterpart, which is an electric DMI characterized by its 𝐃′𝑖𝑗 strength and describing an interaction between two polar displacements ui and uj, has rarely been considered, despite the striking possibility that it could also generate new features associated with non-collinear patterns of electric dipoles. Here we report first-principles simulations combined with group theoretical symmetry analysis which not only demonstrate that electric DMI does exist and has a one-to-one correspondence with its magnetic analogue, but also reveals a physical source for it. These findings can be used to explain and/or design phenomena of possible technological importance in ferroelectrics and multiferroics.
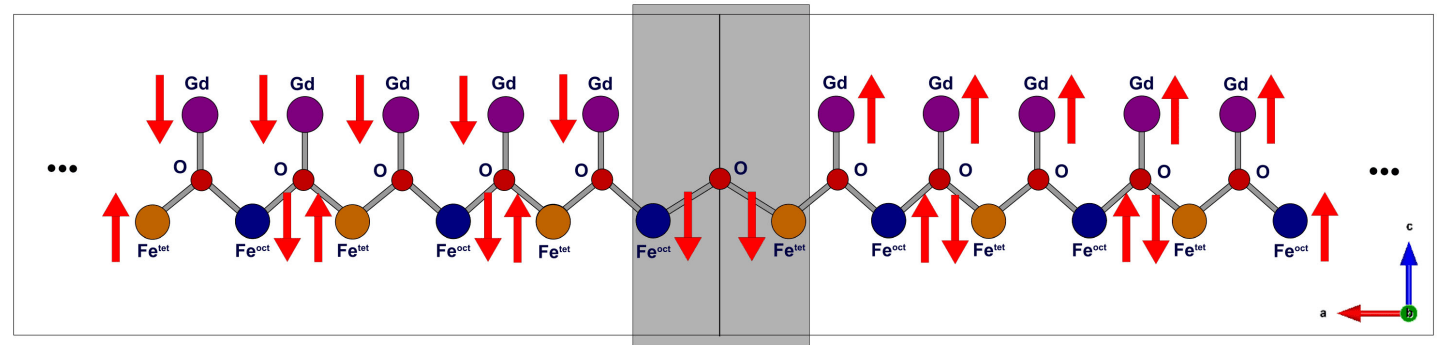
“Magnetic-domain-wall-induced electrical polarization in rare-earth iron garnet systems: A first-principles study,” Temuujin Bayaraa, Changsong Xu, Yali Yang, Hongjun Xiang and L. Bellaiche, Physical Review Letters 125, 067602 (2020). https://doi.org/10.1103/PhysRevLett.125.067602
First-principles methods are employed to understand the existence of magnetic-domain-wall-induced electric polarization observed in rare-earth iron garnets. In contrast with previous beliefs, it is found that the occurrence of such polarization neither requires the local magnetic moments of the rare-earth ions nor noncollinear magnetism. It can rather be understood as originating from a magnetoelectric effect arising from ferromagnetic interactions between octahedral and tetrahedral Fe ions at the domain walls, and the mechanism behind is found to be a symmetric exchange-striction mechanism.
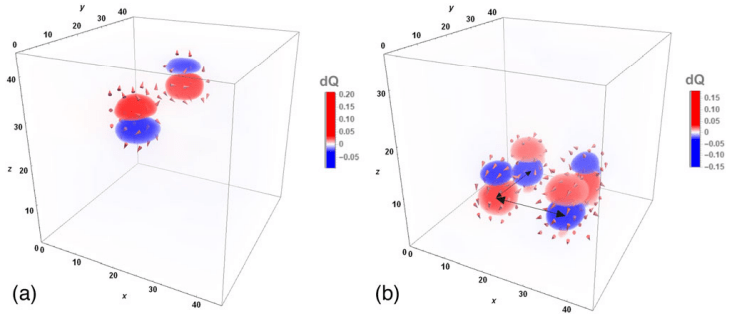
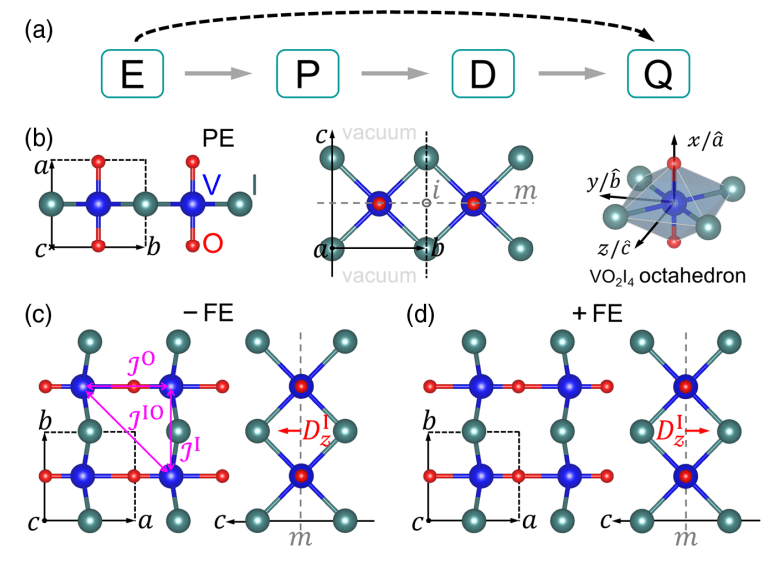
we propose a novel mechanism that realizes the electric-field (E) switching of magnetic topological charge (Q) in a controllable and reversible fashion, through the mediation of electric polarization (P) and Dzyaloshinskii-Moriya interaction (D). Such a mechanism is coined here EPDQ.
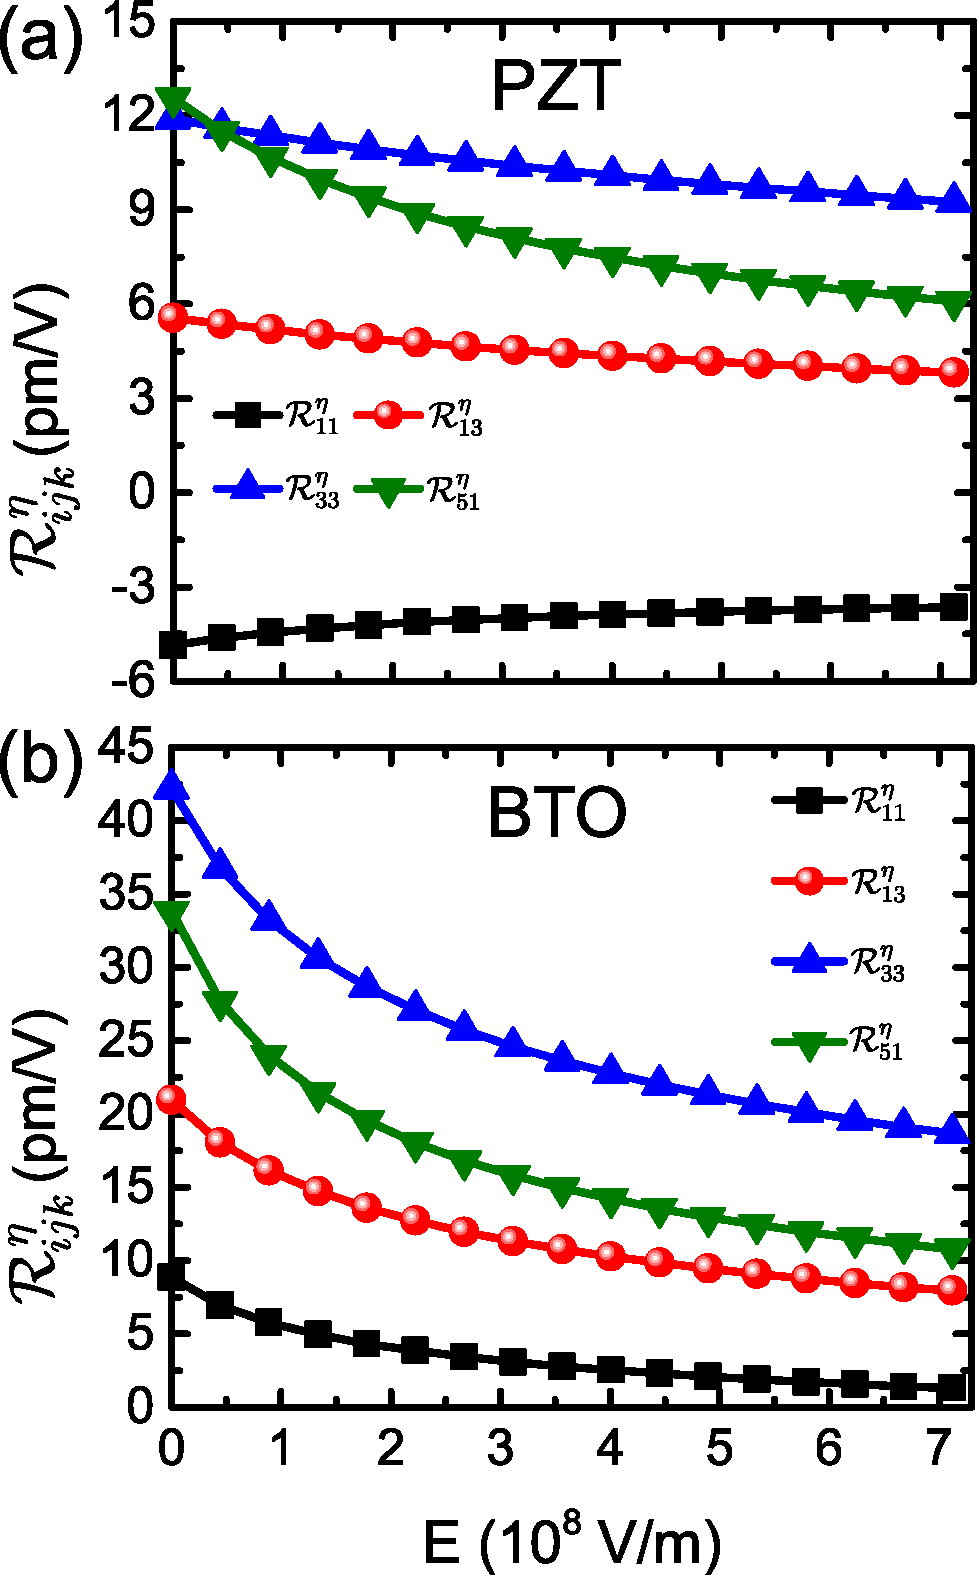
A first-principle technique is developed to tackle the nonlinear electro-optic response of materials at an ab initio level for the first time. This method is presently applied to the R3m phase of Pb(Zr0.52Ti0.48)O3 (PZT) and BaTiO3 (BTO) ferroelectric perovskite oxides. It is found to reproduce a recently observed feature, namely, why PZT adopts a mostly linear EO response while BTO exhibits a strongly nonlinear conversion between electric and optical properties. Figure caption: Clamped EO coefficients as a function of electric field applied along the [111] direction in (a) PZT and (b) BTO, respectively.
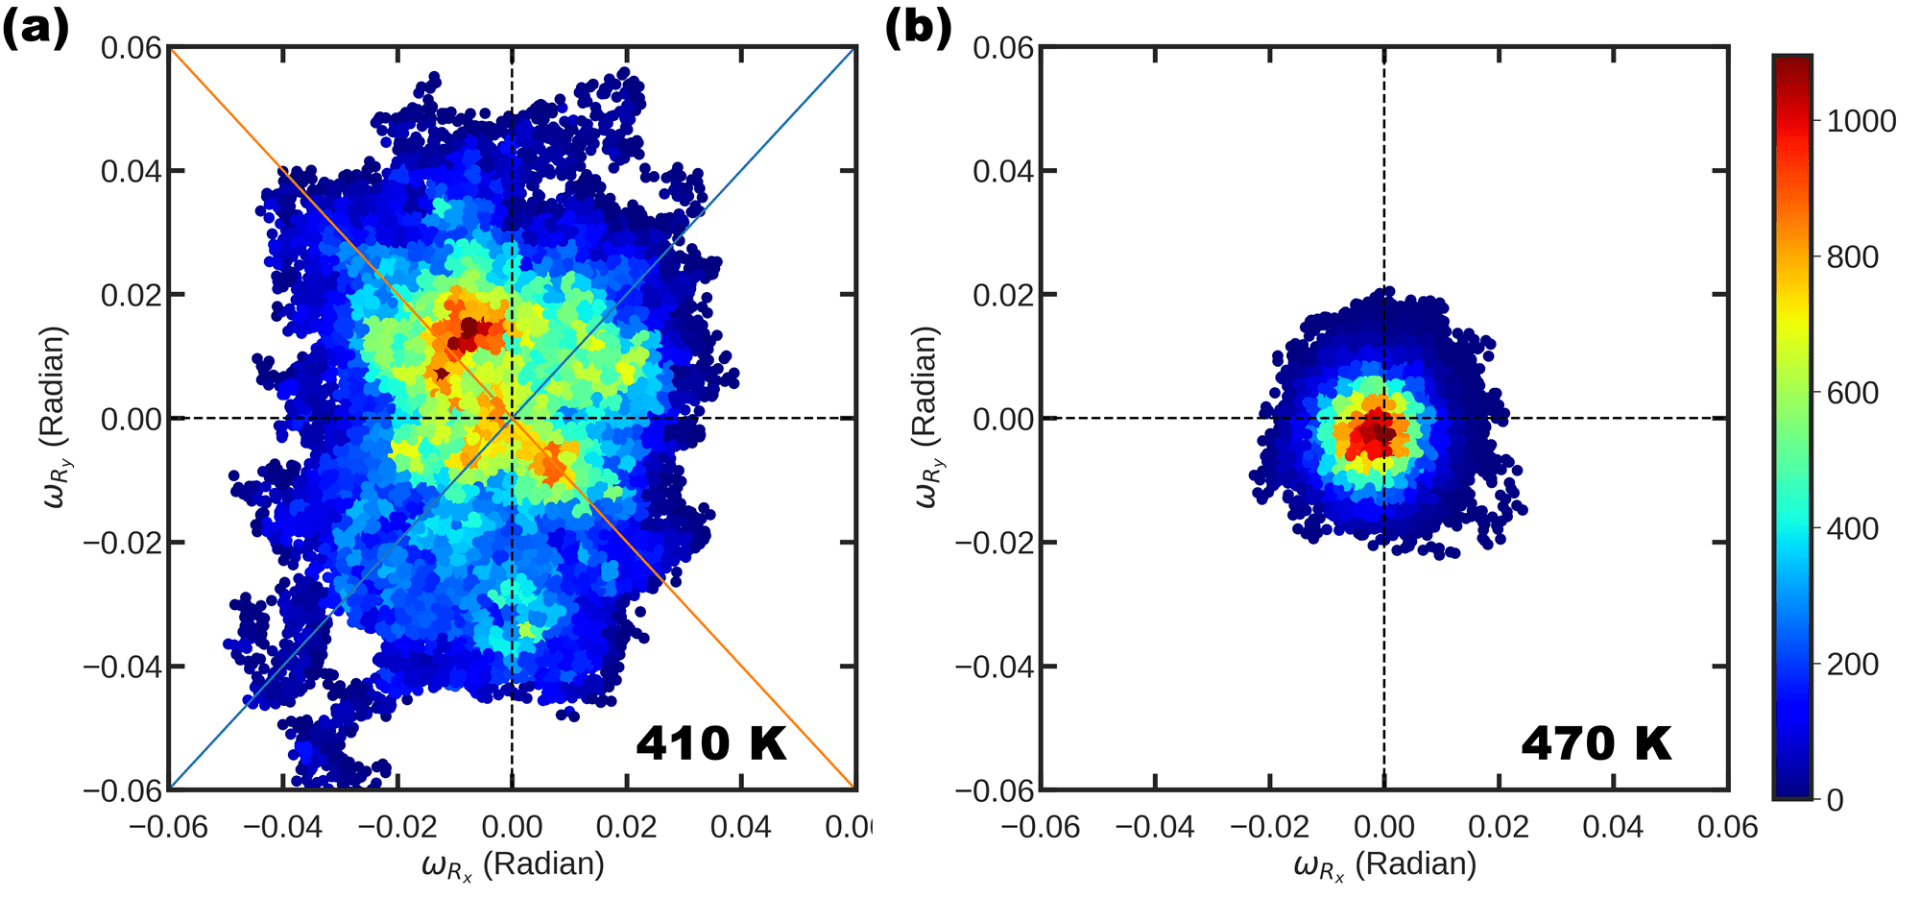
Histogram of the x- and y-components of the antiphase tilting pseudo vector during 40,000 MC sweeps at 410K (Panel a) and 470K (Panel b), as predicted from the effective Hamiltonian with and the other parameters being those of Table I. The oblique lines in Panel (a) correspond to the cases of |ωR,x|=|ωR,y| , that are associated with Pnma minima. The horizontal and vertical dashed lines in Panels (a) and (b) mark the zeroes of and , while the color code for the counts (indicating the number of sweeps specific values of (ωR,x, ωR,y) are encountered in the histogram) is shown in the right part of the panels.
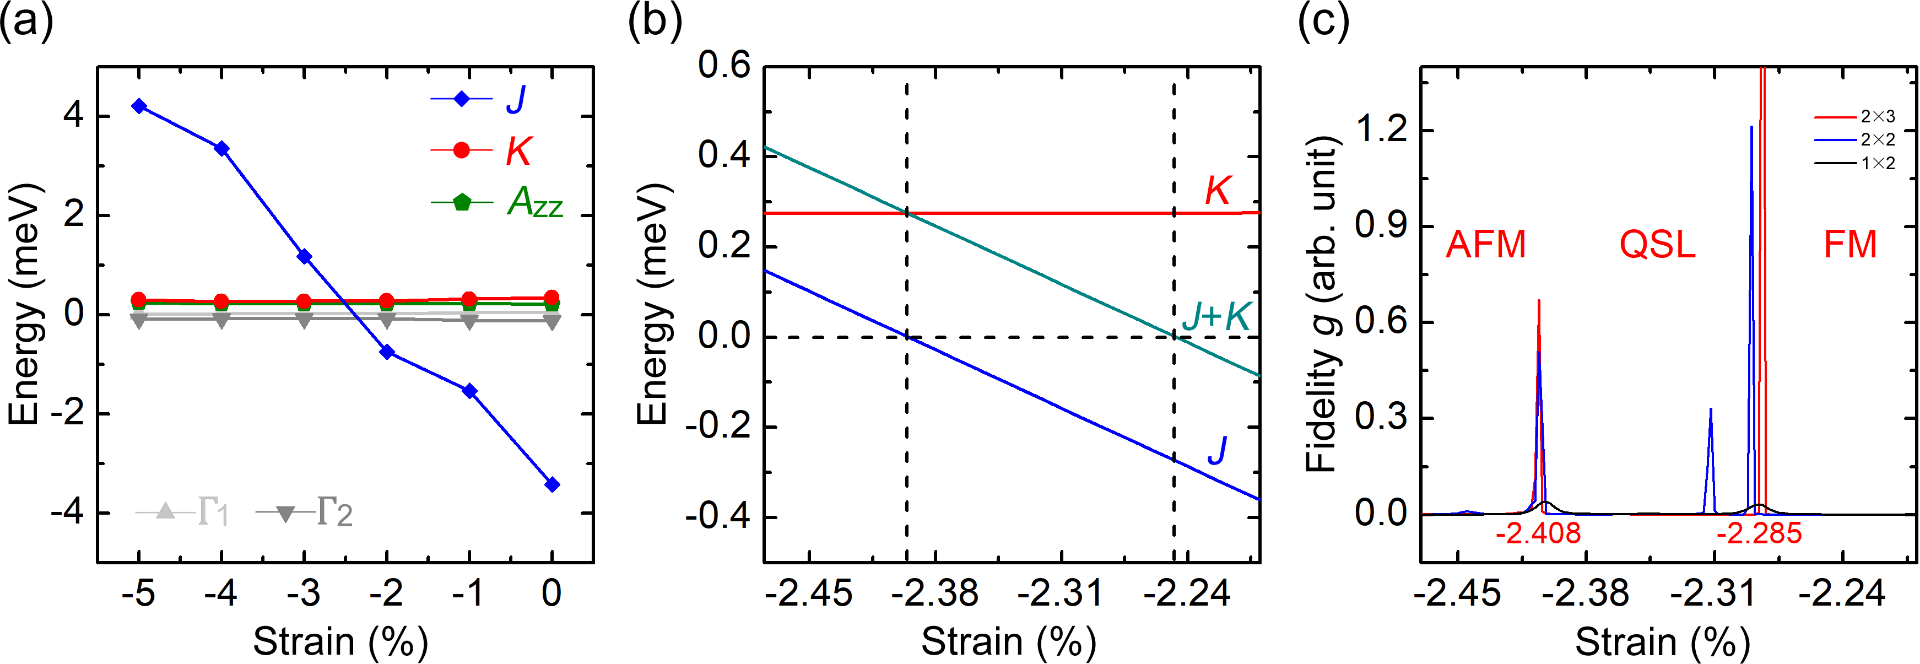
A strong Kitaev term predicted to be found in a series of Cr-based 2D magnets indicates possible quantum spin liquid states in those materials when subjected to epitaxial strain. Caption: Magnetic coefficients and fidelity of CrSiTe3 monolayer. (a) display the evolution of magnetic coefficients as a function of compressive strain. (b) further shows the evolution of J, J+K and K for a specific strain region. The horizontal dashed line indicates the zero in energy, while the vertical lines mark the critical strains at which J or J+K becomes zero. (c) shows the quantity of fidelity g as a function of strain for different sizes of supercells. The peaks in fidelity g indicate phase transitions.
a The evolution with increasing temperature of the labyrinthine domain pattern showing its inverse transition towards the parallel stripe in the middle layer of the PZT film as obtained from MC simulations of the effective Hamiltonian b In-plane piezoresponse force microscopy phase images of a thin BiFeO3 film showing the inverse transition from labyrinth to parallel stripes domain morphologies.
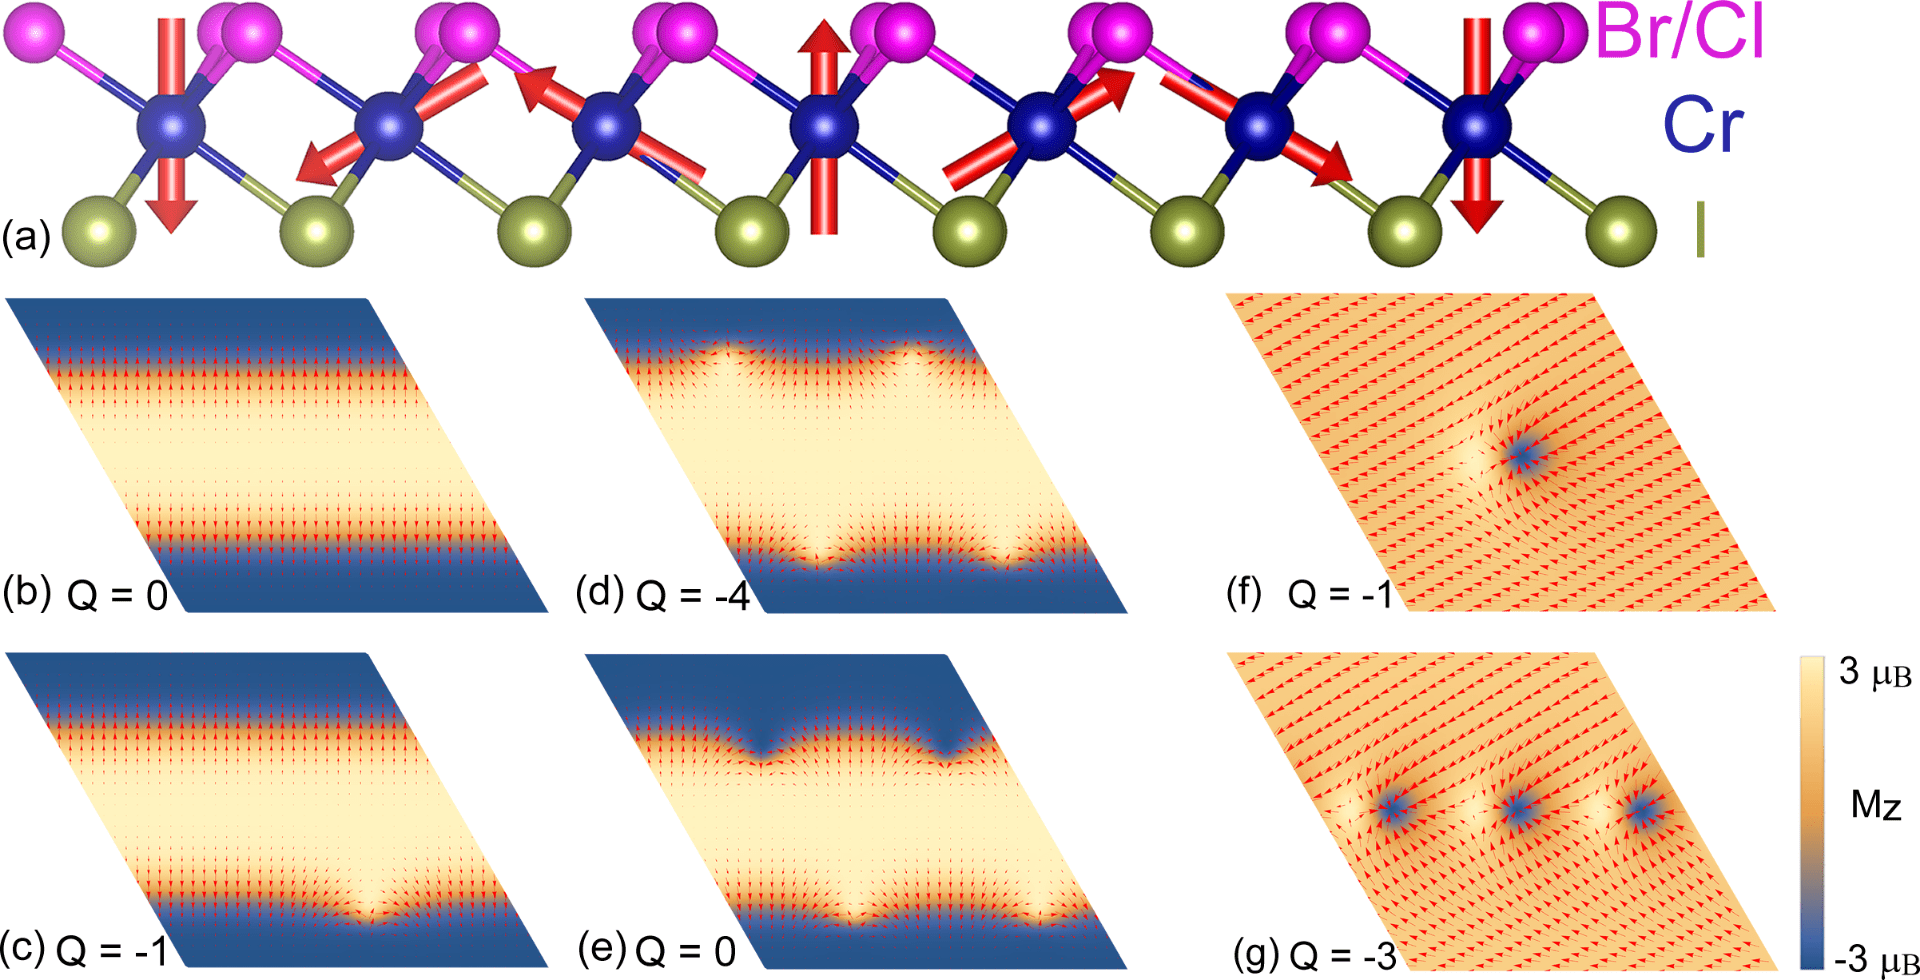
By construction of Janus monolayers of Cr(I,Br)3 and Cr(I,Cl)3, we identify stronge Dzyaloshinskii-Moriya interaction (DMI) there, which results in topologically nontrivial spin textures, such as domain wall skyrmion and bimerons. Figure caption: (a) schematics of Janus monolayers of Cr(I,Br)3 and Cr(I,Cl)3; (b-e) spin textures of Cr(I,Br)3 and (f,g) spin textures of Cr(I,Cl)3 with different topological charges. The color map applies to the out-of-plane component of the spin vectors (“spin-in” and “spin-out,” for negative (dark) and positive (bright) z components, respectively) while the arrows characterize the in-plane components of the spin vectors.
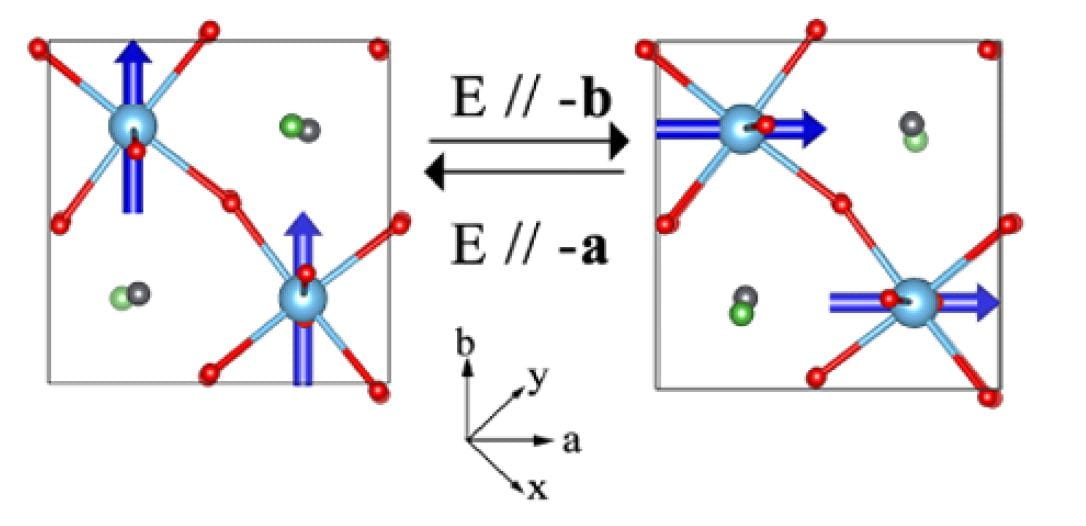
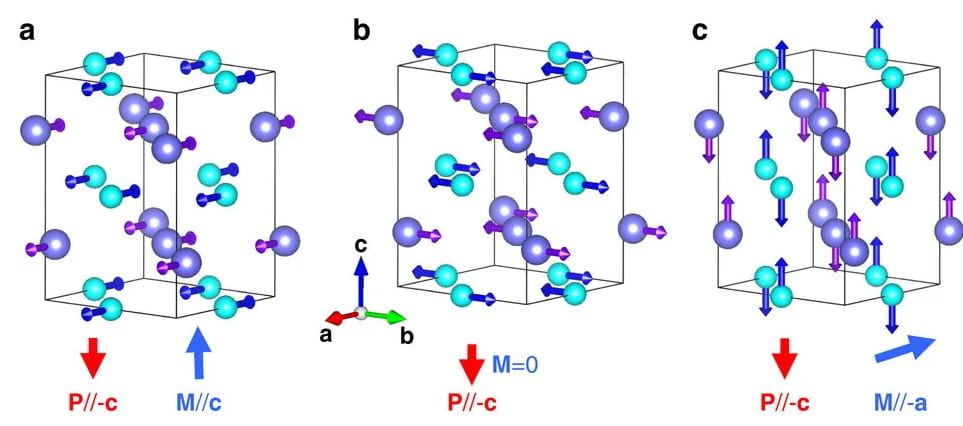
Ferromagnetic vector switches by 90 degree when polarization is switched by 90 degree by electric field.
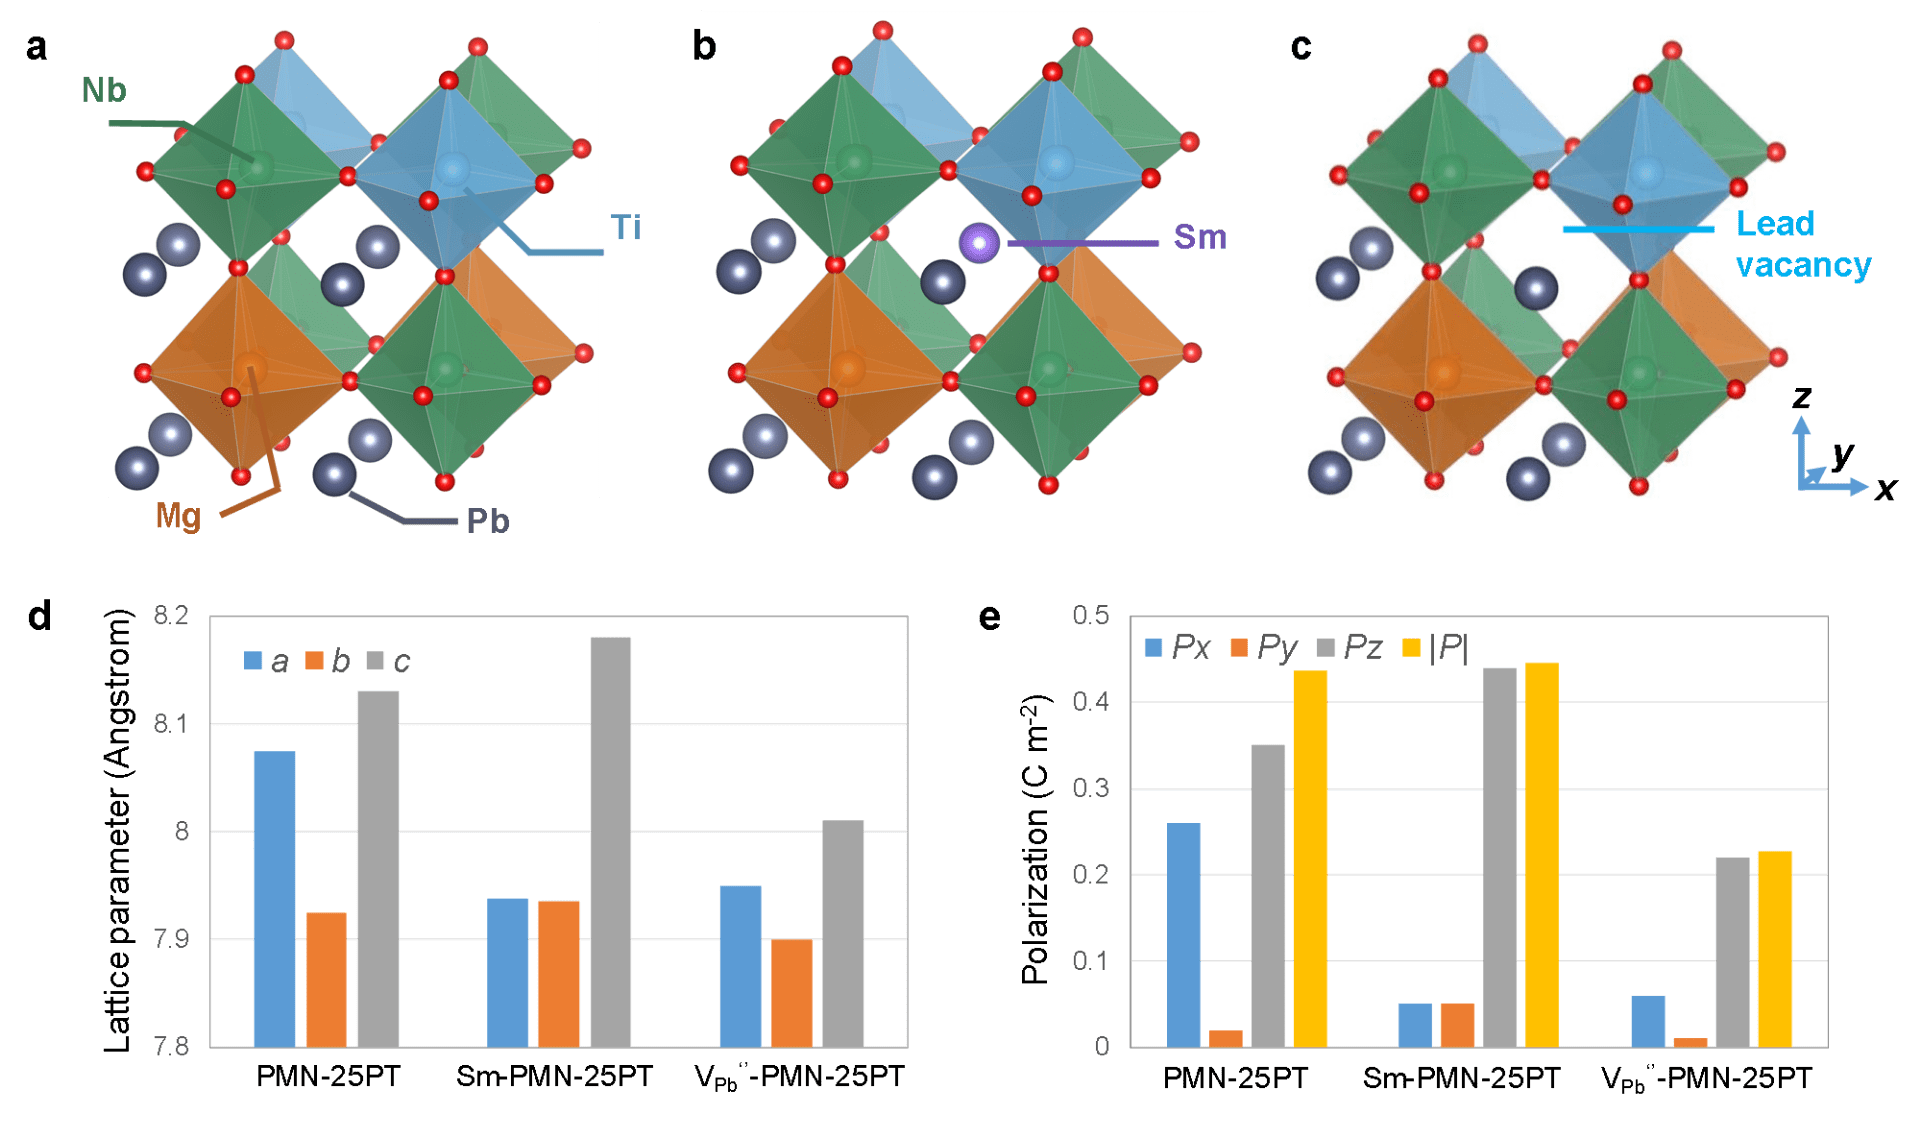
First-principles calculations for Sm-doped PMN-PT. (A) The 2×2×2supercell of PMN-25PT that is used for calculations. (B) Schematic of the supercell used to study the impact of Sm3+ on lattice parameters and polarizations. (C) Schematic of the supercell used to study the impact of lead vacancy on lattice parameters and polarizations. (D) Lattice parameters for PMN-25PT, Sm-doped PMN-25PT, and PMN-25PT with lead vacancy. (E) Spontaneous polarizations for PMN-25PT, Sm-doped PMN-25PT, and PMN-25PT with lead vacancy. Px, Py,and Pz are the polarizations along x, y,and z directions, respectively; |P| is the magnitude of spontaneous polarization.

The Pb displacements in incommensurate modulations of PbZrO3-based AFEs can be either antiparallel, but with different magnitudes along opposing directions, or in a nearly orthogonal arrangement; i.e., these previously thought fully compensated AFE domains, in fact, bear a net polarization.
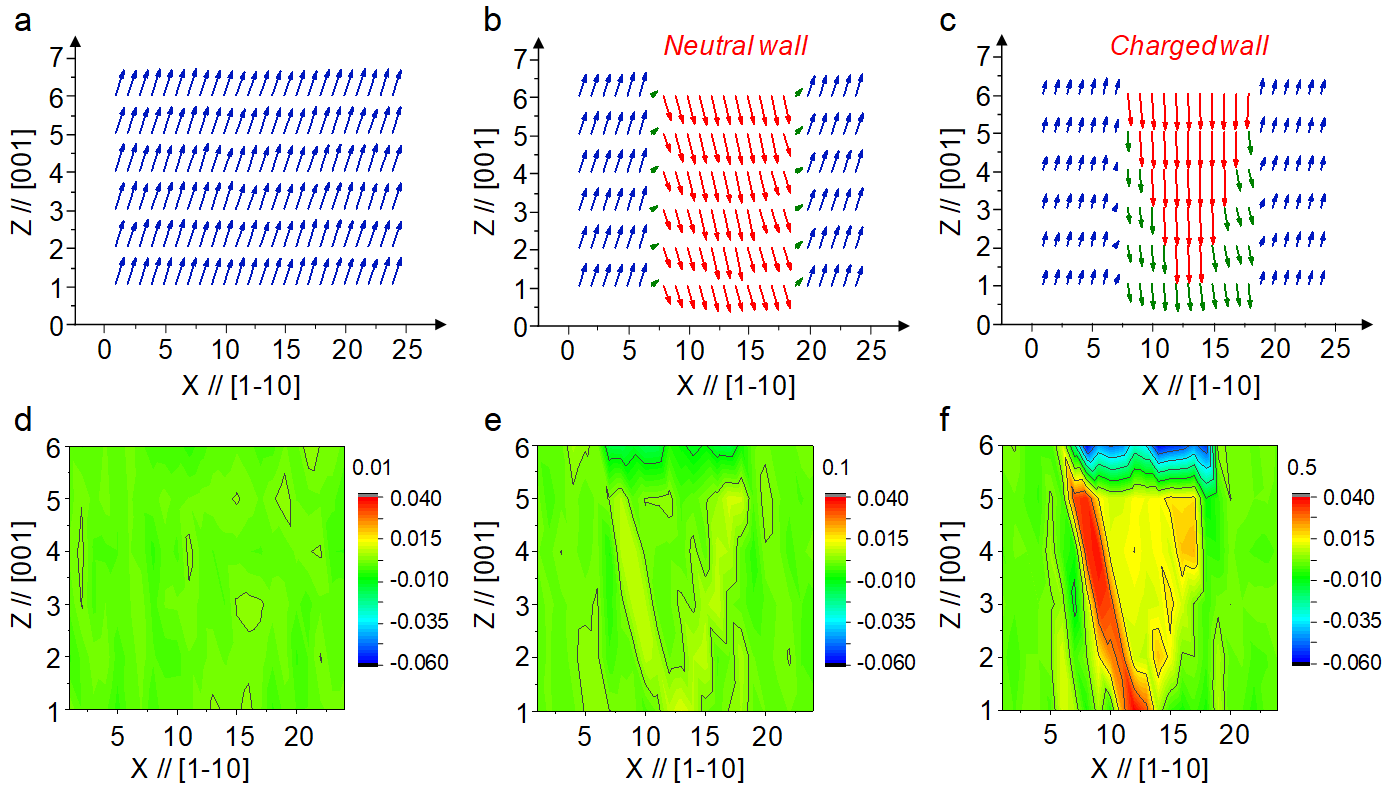
Dipole pattern and resulting charge distribution in a given (010) plane, as predicted from our effective Hamiltonian scheme. The strength of the inhomogeneous field, S, is taken to be 0.01 in panels a&d, 0.1 in panels b&e, and 0.5 a.u. in panels c&f.
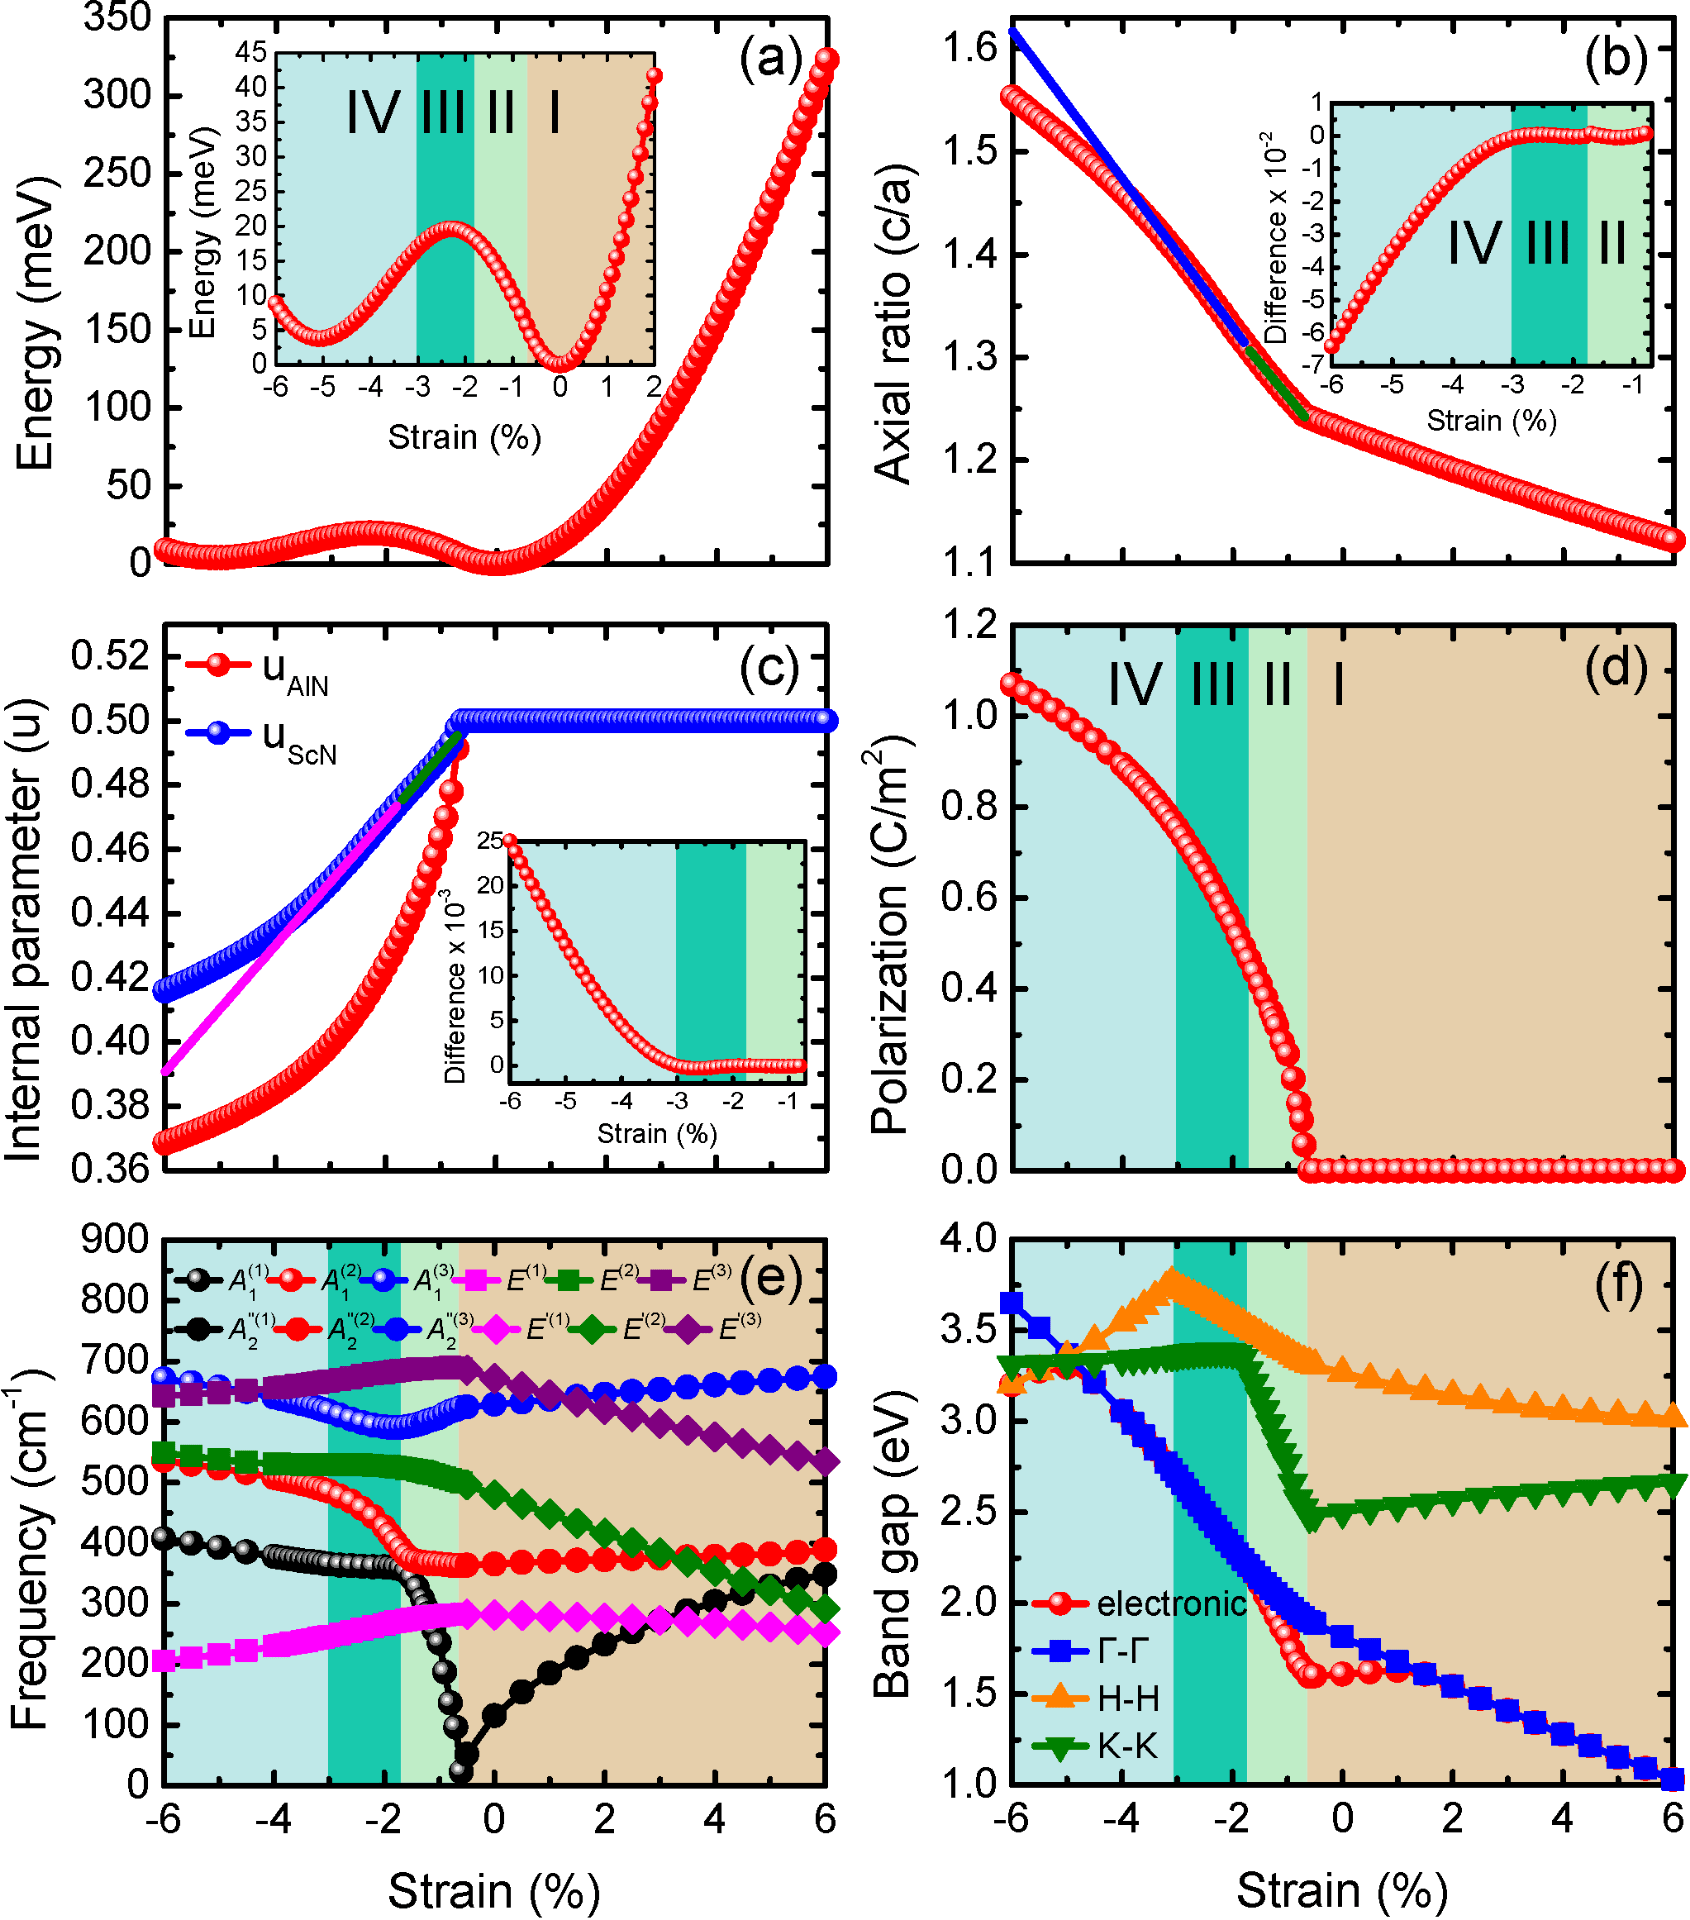
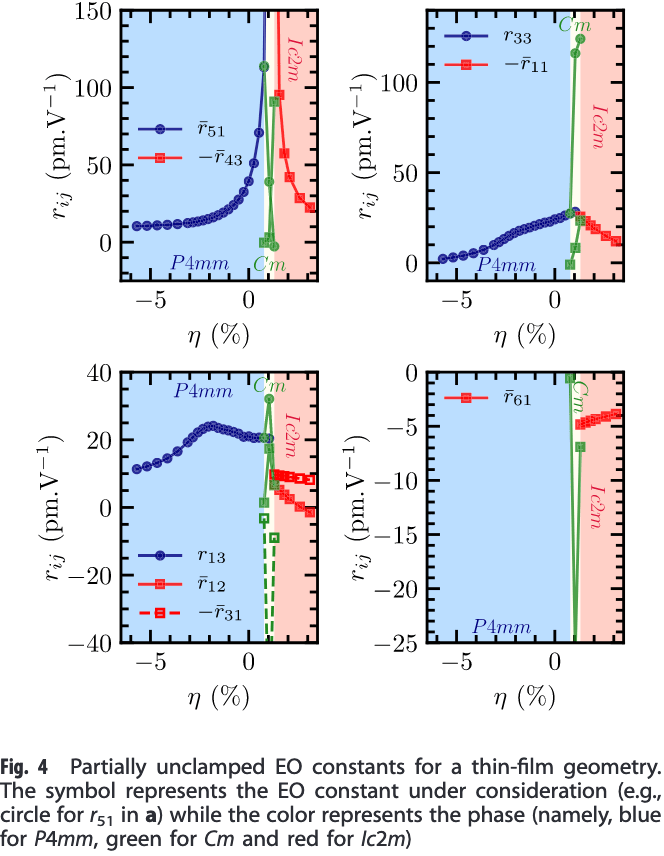
Structural properties of 1×1 AlN/ScN as a function of strain: (a) total energy (the inset zooms in the data for strains between -6% and +2%); (b) axial ratio c/a [the inset shows the difference between the c/a data and two straight lines that pass through Regions II (green line) and III (blue line)]; (c) internal parameters [the inset shows the difference between the uScN data and two straight lines that pass through Regions II (green line) and III (magenta line)]; (d) polarization Pz; (e) phonon spectrum at the Γ point of the first Brillouin zone; (f) the electronic band gap and the direct band gaps at Γ, H and K.
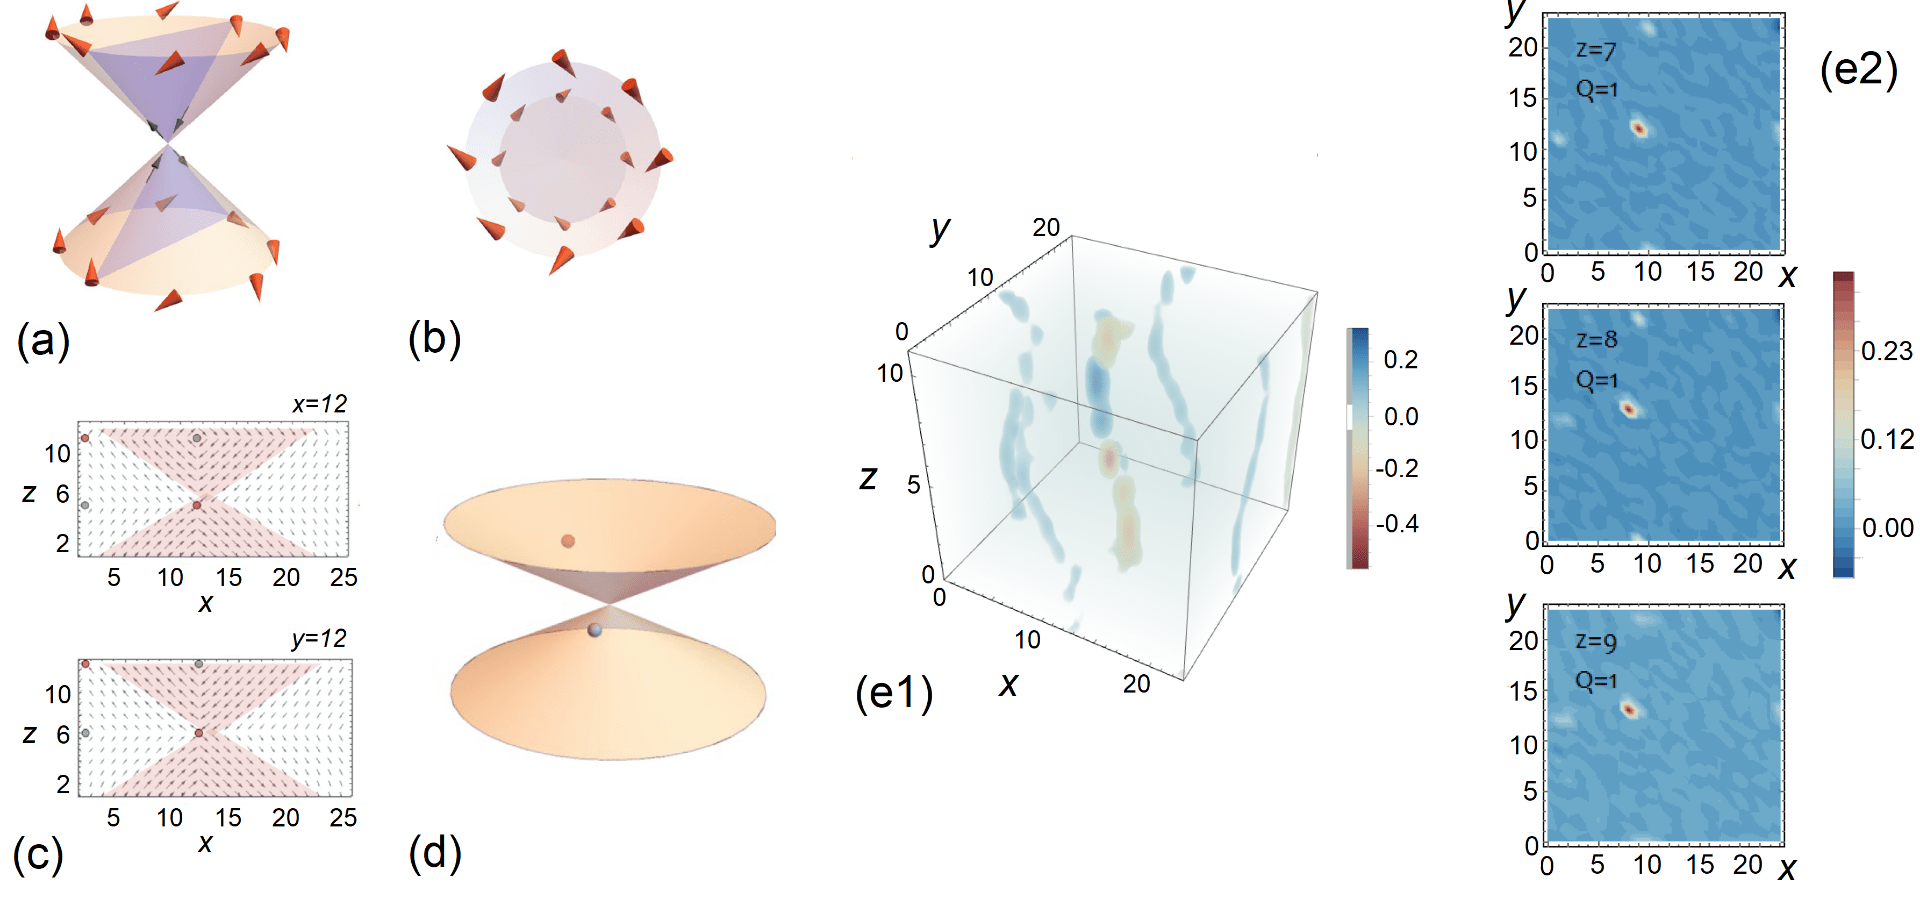
Dipolar structure and topology of the “topological eclecton” at 10 K. Panels (a) and (b) show a schematization of the dipolar structure. Panel (a) corresponds to a general viewpoint position while panel (b) depicts the top view from the z axis (due to perspective, the circle corresponding to the lower cone base appears to have a smaller diameter than that of the upper cone base). In both panels (a) and (b), orange arrows indicate the orientation of the dipoles on the outer surfaces of the cones. The blue triangle in panel (a) shows a (y,z) cross section of the cones passing through the revolution axis. The in-plane projection of the dipoles located at this cross section exhibits an antivortex at the meeting point of the cone tips schematically indicated by small black arrows in panel (a). A complete projection plot within the (y,z)and(x,z) planes passing through the center of the cones is shown in panel (c) where vortex and antivortex cores are indicated with blue and red circles, respectively. Panel (d) shows the location of hedgehog (red sphere) and antihedgehog (blue sphere) point defects. Panel (e1) shows the distribution of the Pontryagin charge density within the (x,y) planes in the full supercell. Panels (e2) show the Pontraygin charge density distribution in the three (x,y) planes that host skyrmions.
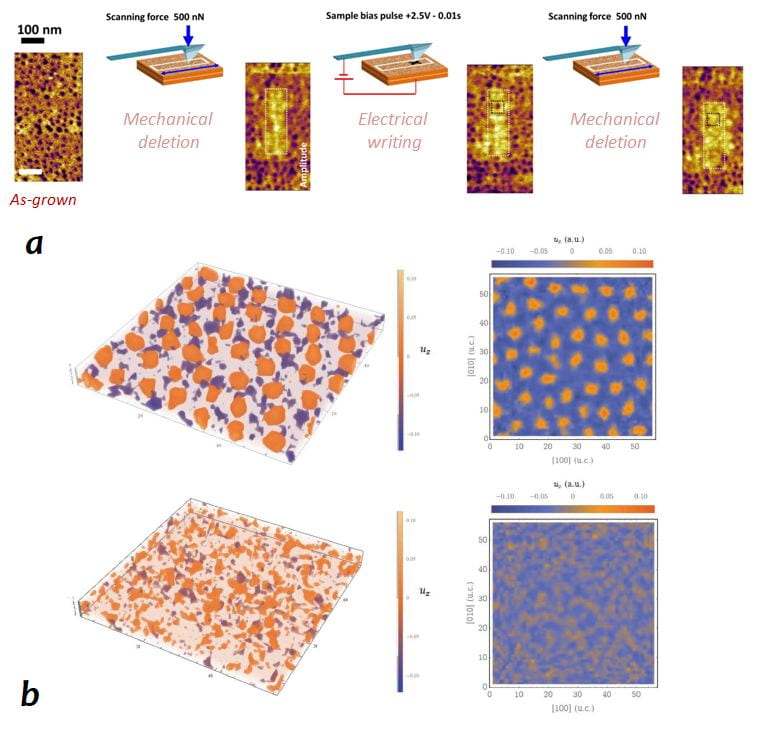
a Domain deletion by mechanical switching using an AFM probe and domain writing by electric switching using an AFM probe showing the reversible manipulation showing the Reversible mechanical–electrical switching of the bubble domains b MC simulations of the effective Hamiltonian showing the deletion of the bubble domains upon the application of uniaxial stress perpendicularly to the film’s surface.
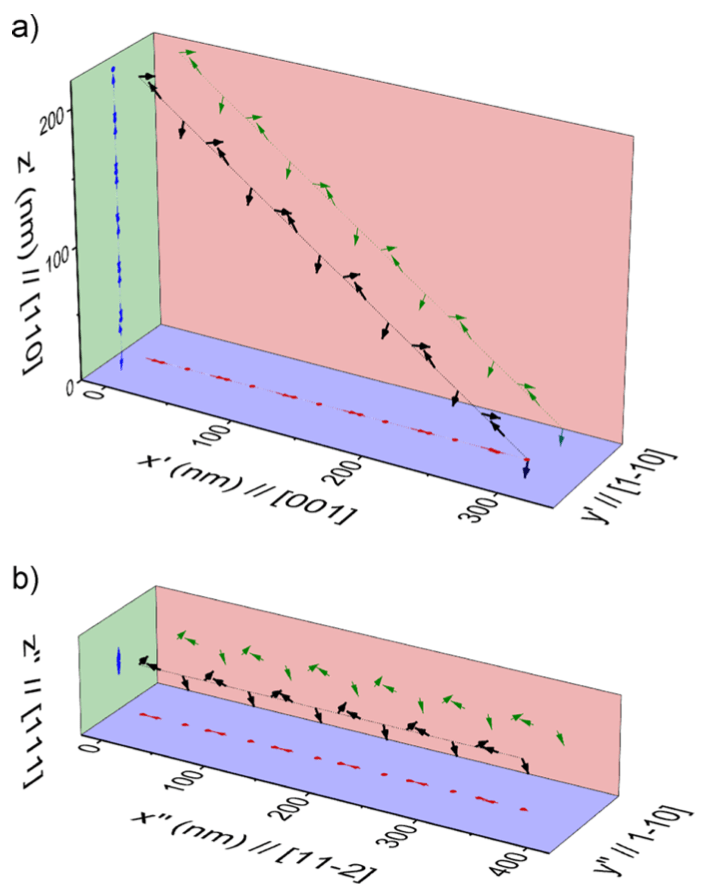
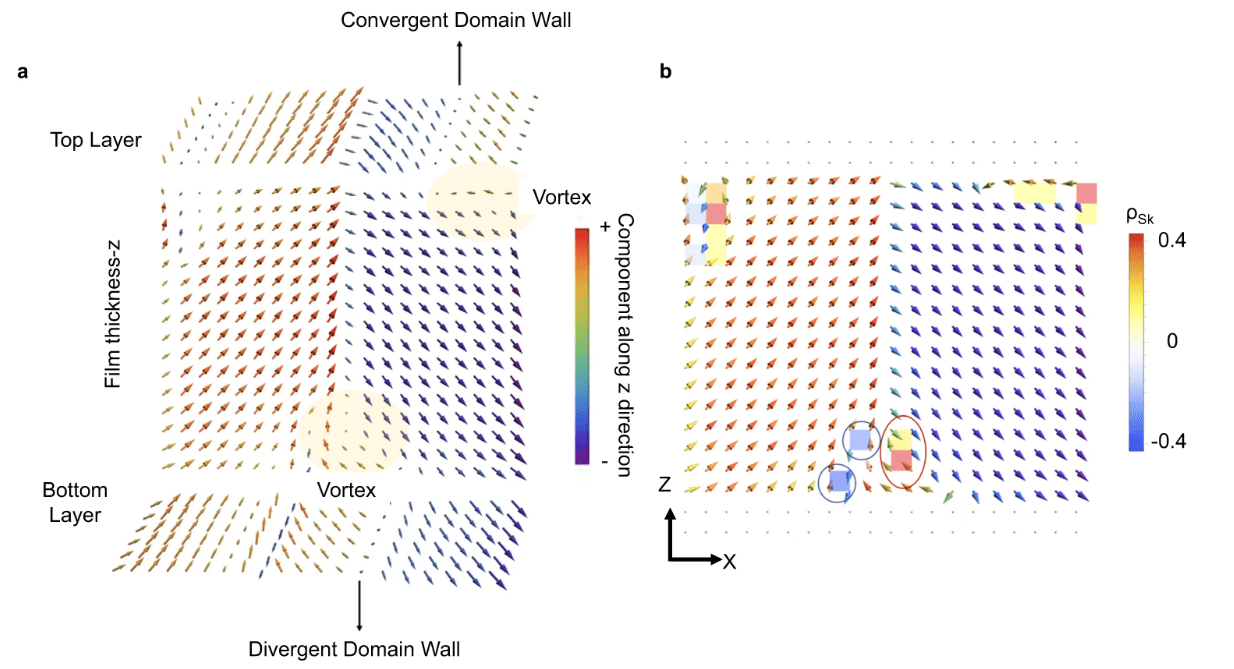
Spin structure as determined from first-principles-based calculations. In a) the spin structure in the same geometry as the thin film is shown, with x′ || [001] along the in-plane direction, and z′ || [110] normal to the film plane. Here in a 200 nm film the 18 × 18 × 18 supercell reproduces ~6 full cycloids. b) shows the cycloid spins are almost completely confined to the ð110Þ plane structure along the [11-2] propagation direction, showing that the Fe spins are almost completely confined to the (1-10) plane.
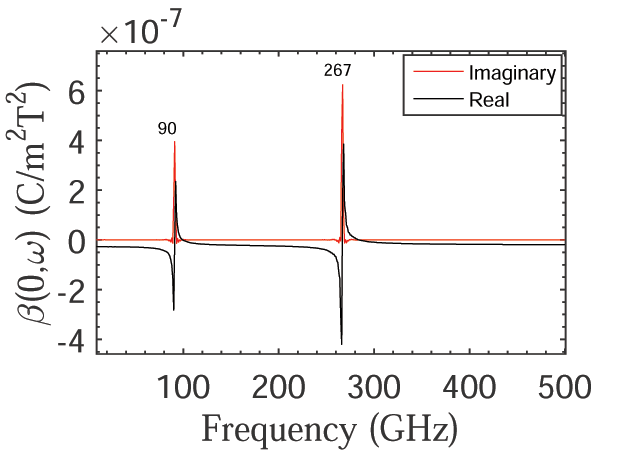
Dependency of the real and imaginary parts of β(0,ω), dynamical quadratic magnetoelectric coefficient of BiFeO3, on the frequency of the ac applied magnetic field when the homogeneous strain is relaxed in the MD simulations.
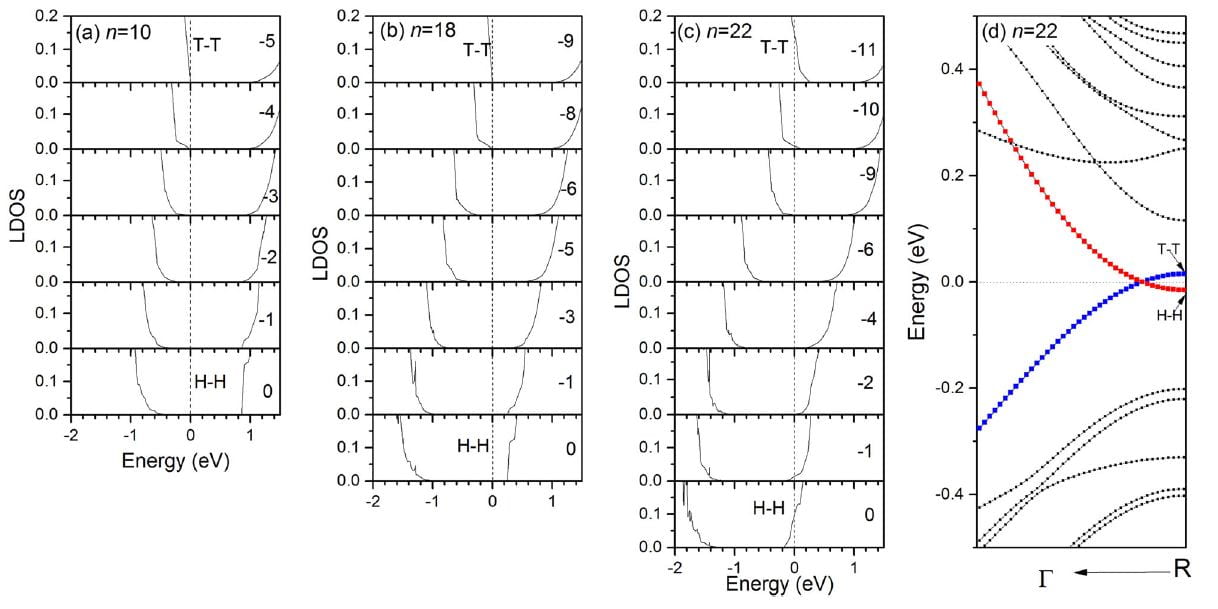
Electronic properties of P[103]&P[−103] domain structures of MAPbI3. a–c report the layer-resolved local density of states for the 10 ×1 × 1, 18 × 1 × 1, and 22 × 1 × 1 configurations, respectively, when going from the T-T (top figure) to H-H (bottom figure) layers. d shows the energy band structure for the n = 22 case. Note that the numbers “−5”,.. “0” indicated in a correspond to the layers shown in Fig. 1, and a similar nomenclature is used for b and c. The vertical dashed lines in a–c represent the energy of the Fermi level (which is chosen to be the zero in energy).
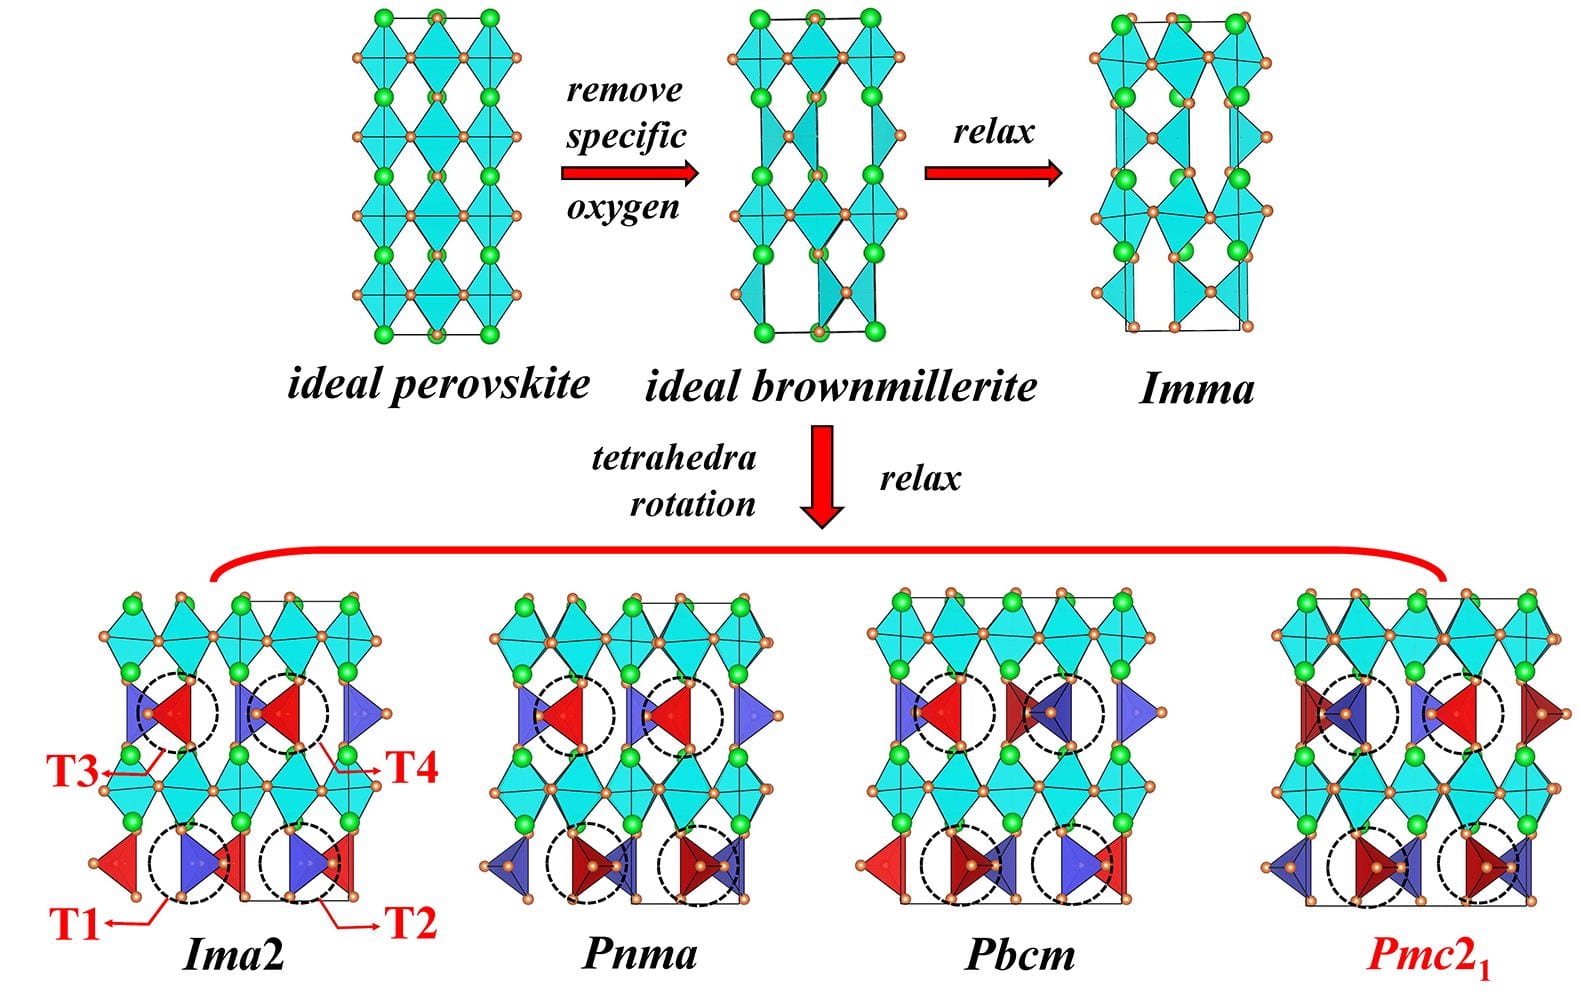
Schematization of the construction of the ideal brownmillerite structure from the ideal perovskite structure and resulting relaxations allowing for the formation of the high-symmetry Imma state as well as for lower-in-symmetry Ima2,Pnma,Pbcm, and Pmc21 phases of brownmillerites. The tilting pattern of the T1, T2, T3, and T4 oxygen tetrahedra (see text) is emphasized for each of these low-symmetry phases, with red and blue colors representing clockwise and anticlockwise rotation about the z axis, respectively.
a Dipole disclination as revealed by high-resolution scanning transmission electron microscopy in lead titanate (PTO) film layer b Dipole disclination as obtained from numerical simulations using effective Hamiltonian scheme in a ultrathin PTO film.
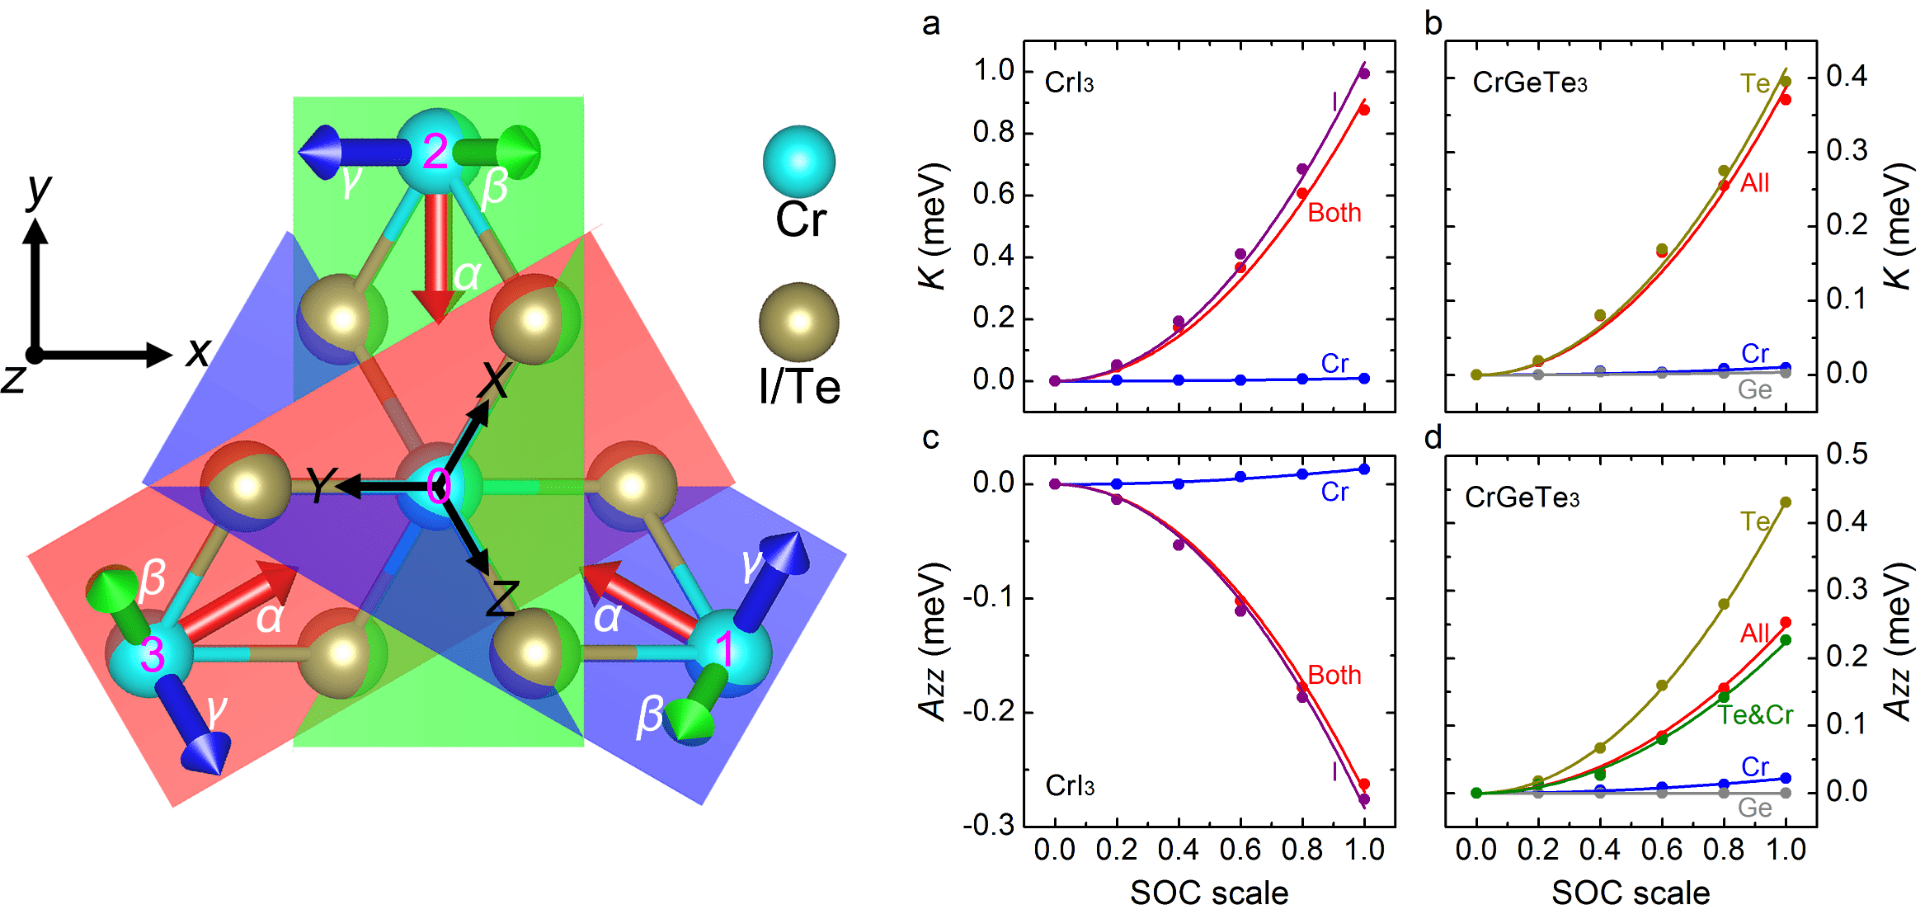
In this work three major achievements: (1) the existence of Kitaev interaction in CrI3 and CrGeTe3; (2) collaboration (competition) of Kitaev interaction and single ion anisotropy (SIA) leads to the specific anisotropy of CrI3 (CrGeTe3); and (3) both Kitaev interaction and SIA arise from strong SOC of lignads (I or Te). Figure caption: Left panel shows the global {xyz}, {XYZ} and local {αβγ} bases; (a) and (b) show the dependency of K of CrI3 and CrGeTe3, respectively, as a function of the SOC strength. (c) and (d) display the dependency of Azz for CrI3 and CrGeTe3, respectively, as a function of this SOC strength. Note that the value of 1.0 (0, respectively) for this SOC strength corresponds to the actual strength (no SOC, respectively) of the considered element.
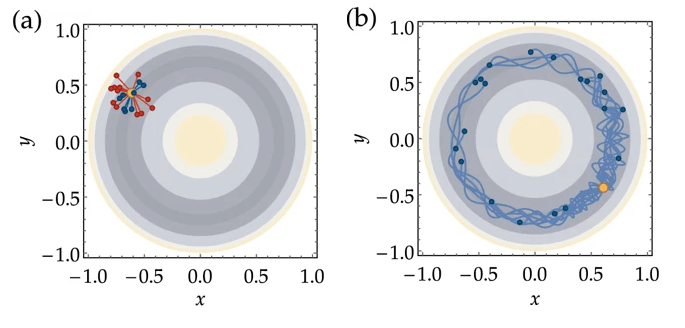
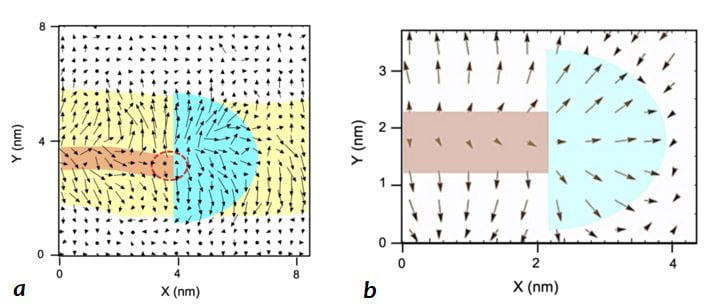
Illustration of the single-step sampling trials of the Mexican hat potential by (a) Metropolis Monte Carlo and (b) Hybrid Monte Carlo algorithms.
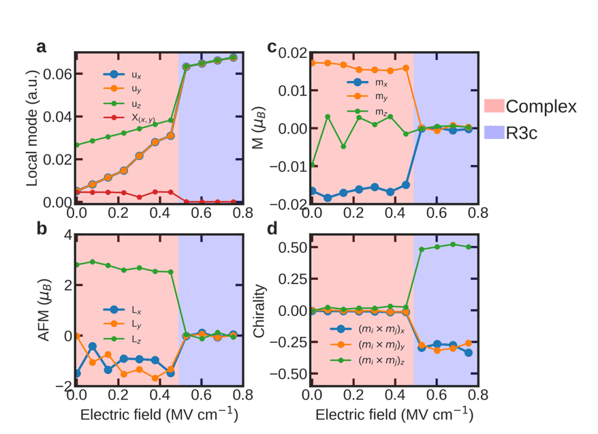
Monte Carlo simulations of electric field-induced magnetic transitions for Bi0.8375Nd0.1625FeO3 solid solution at 300 K (increasing field). a) Electric- field dependency of the supercell averages of the local modes, u and X, characterizing ferroelectricity and antiferroelectricity, respectively. b) Electric-field dependency of the supercell averages of the antiferromagnetic vector. c) Electric-field dependency of the supercell averages of the weak magnetic vector. d) Electric-field dependency of the supercell averages of the chirality vector of the magnetic structure, characterizing the transition from AFM to cycloid.
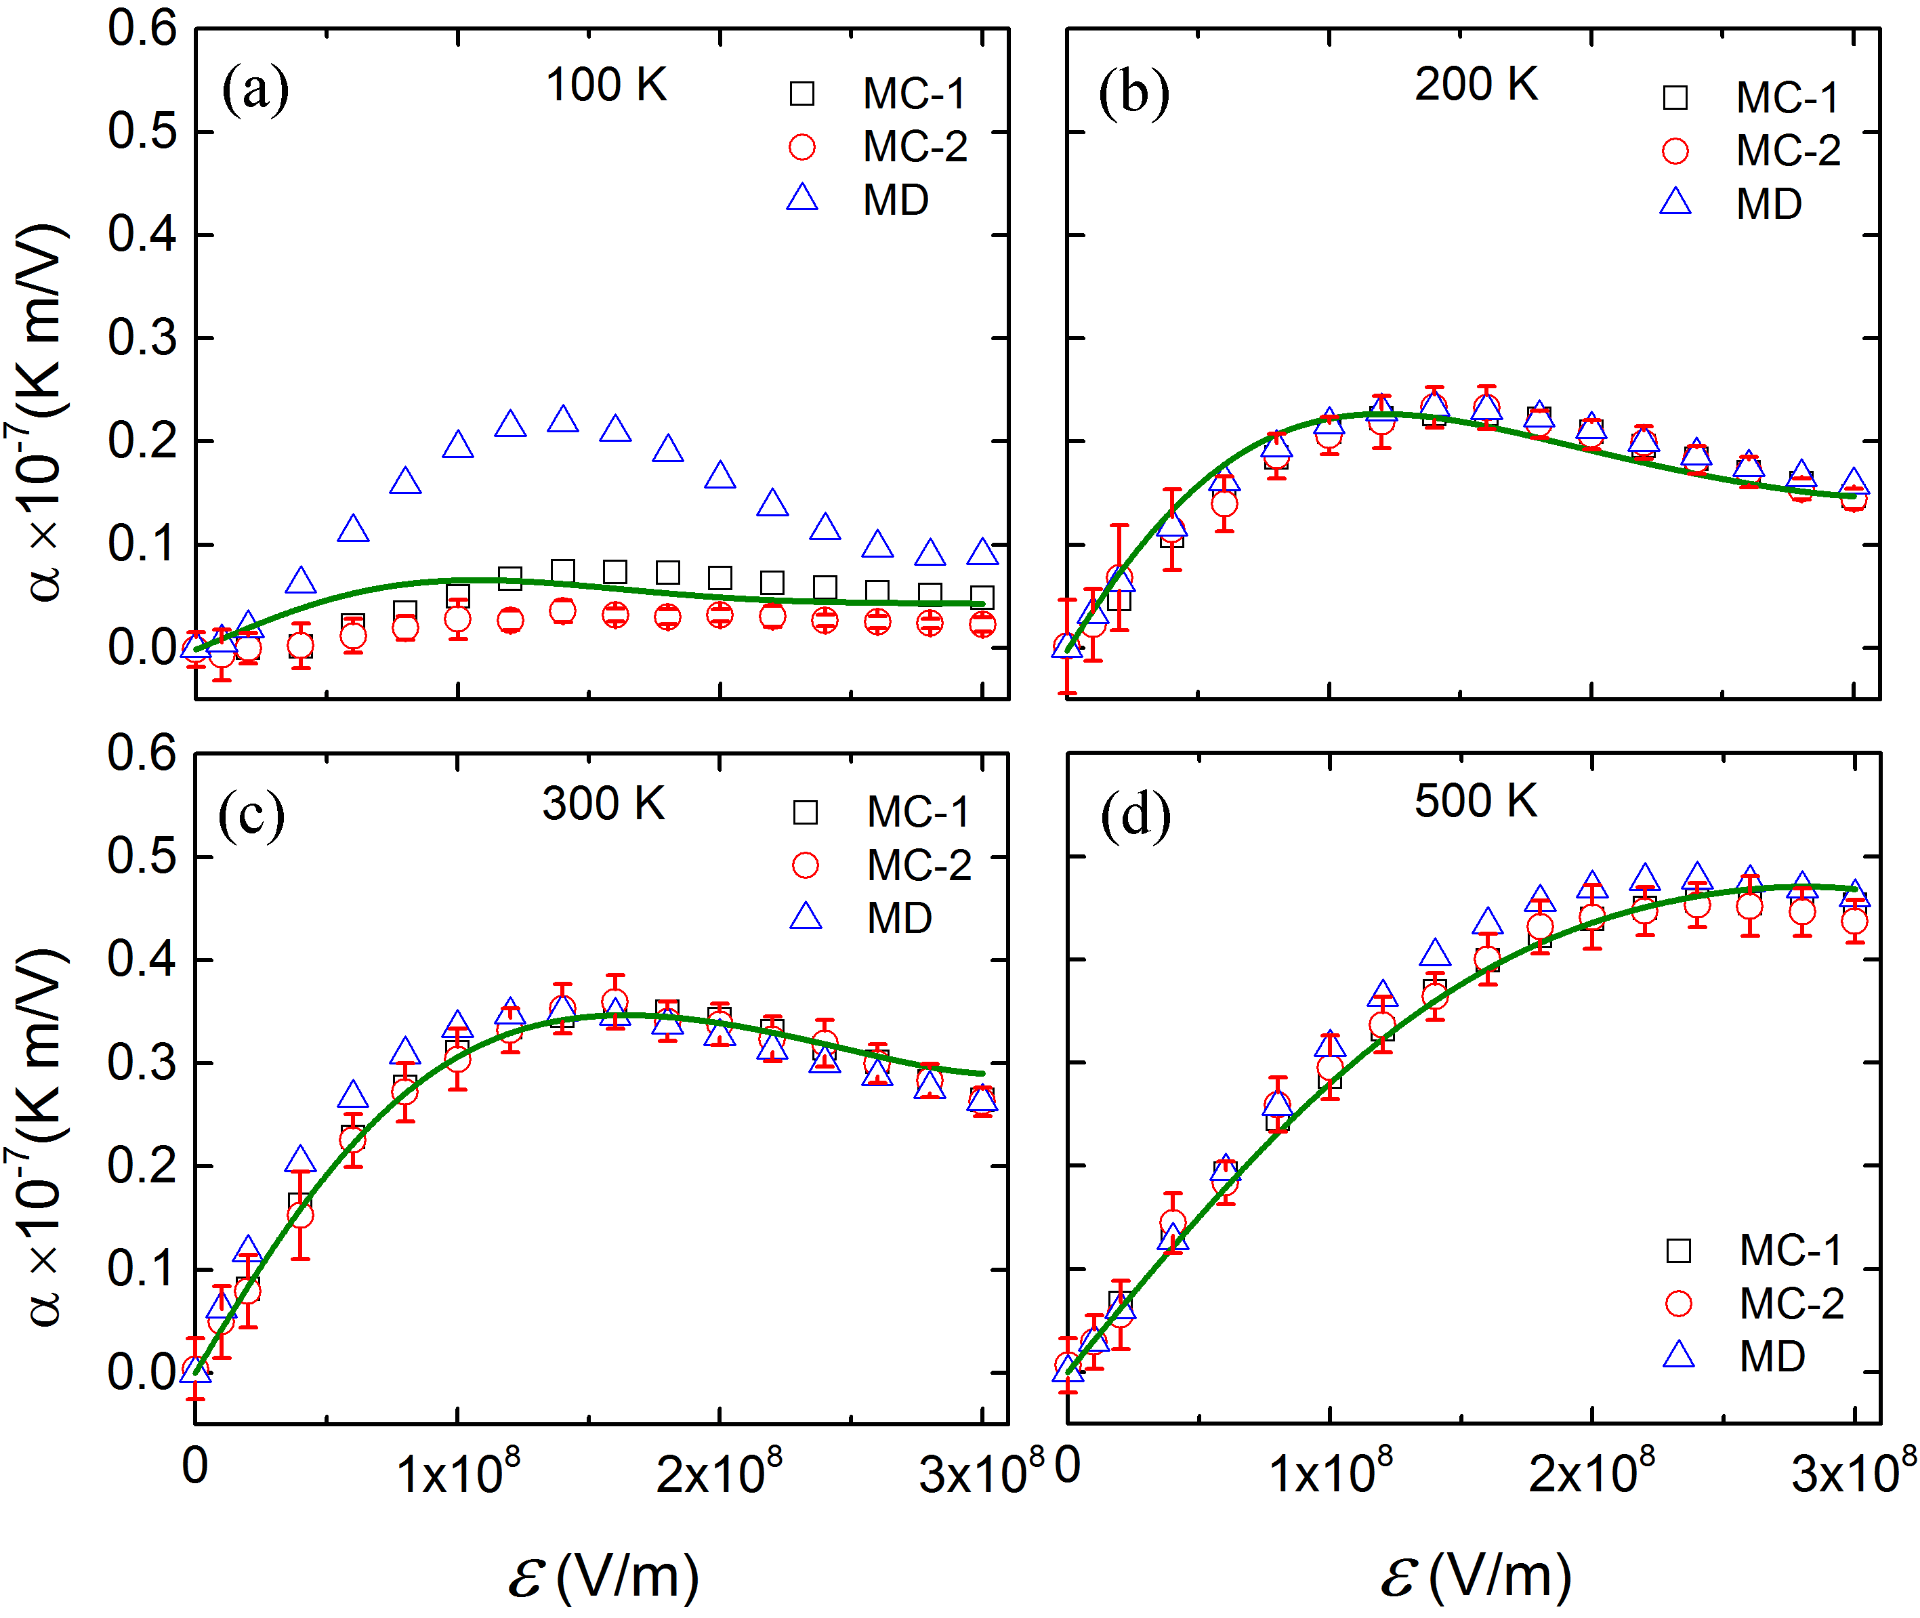
Electrocaloric coefficient, α, as a function of the applied dc electric field E, as predicted for the different indirect and direct approaches at 100 K, 200 K, 300 K and 500 K (panels (a)-(d), respectively). The solid green line represent the fit of the MC-1 and MC-2 results. Error bars (resulting from the use of 20 different disordered alloy configurations) are also shown for the MC-2 data.
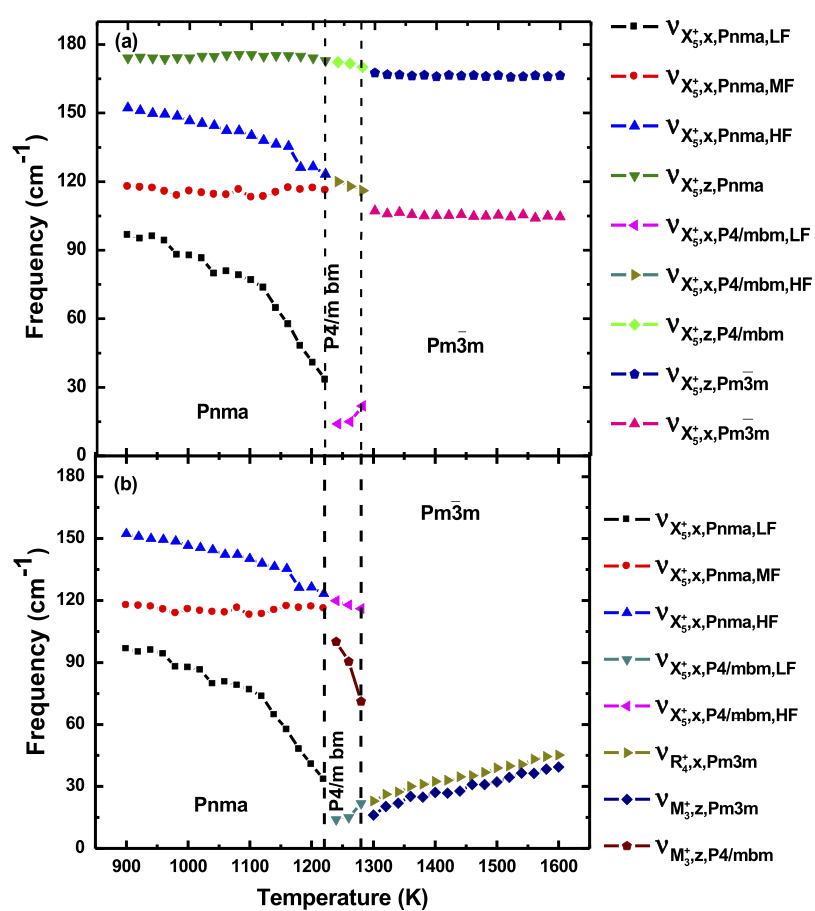
Temperature dependence of natural frequencies of some phonon modes that have antipolar cation character a and/or oxygen octahedral tiltings character b. The vertical dashed lines delimit the different phases obtained in the calculations for our BFO system subject to hydrostatic pressure.
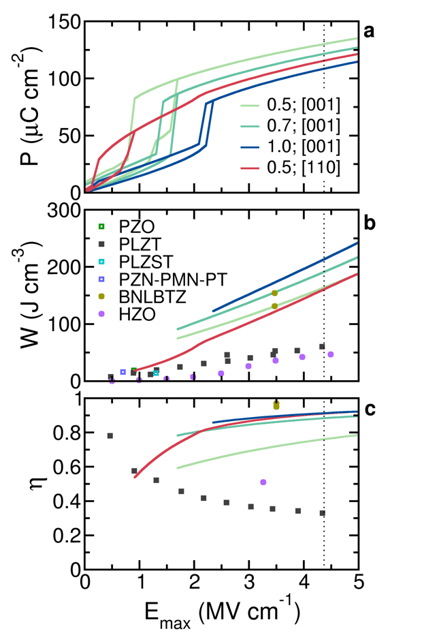
The computed energy storage performance of selected Bi1-xNdxFeO3 solid solutions. (a) The P–E hysteresis curves. (b) The energy density as a function of the magnitude of the maximum applied electric field, with the discrete symbols representing the best available experimental data from different types of materials, that is, lead-based (PbZrO3 (PZO), PLZT, (Pb,La)(Zr,Sn,Ti)O3 (PLZST) and Pb(Zn1/3Nb2/3)O3-Pb(Mg1/3Nb2/3)O3-PbTiO3 (PZN-PMN-PT)), and lead-free (BNLBTZ and HZO) systems. (c) The efficiency as a function of the magnitude of the maximum applied electric field. The dotted vertical line denotes the estimated intrinsic breakdown field for BFO.
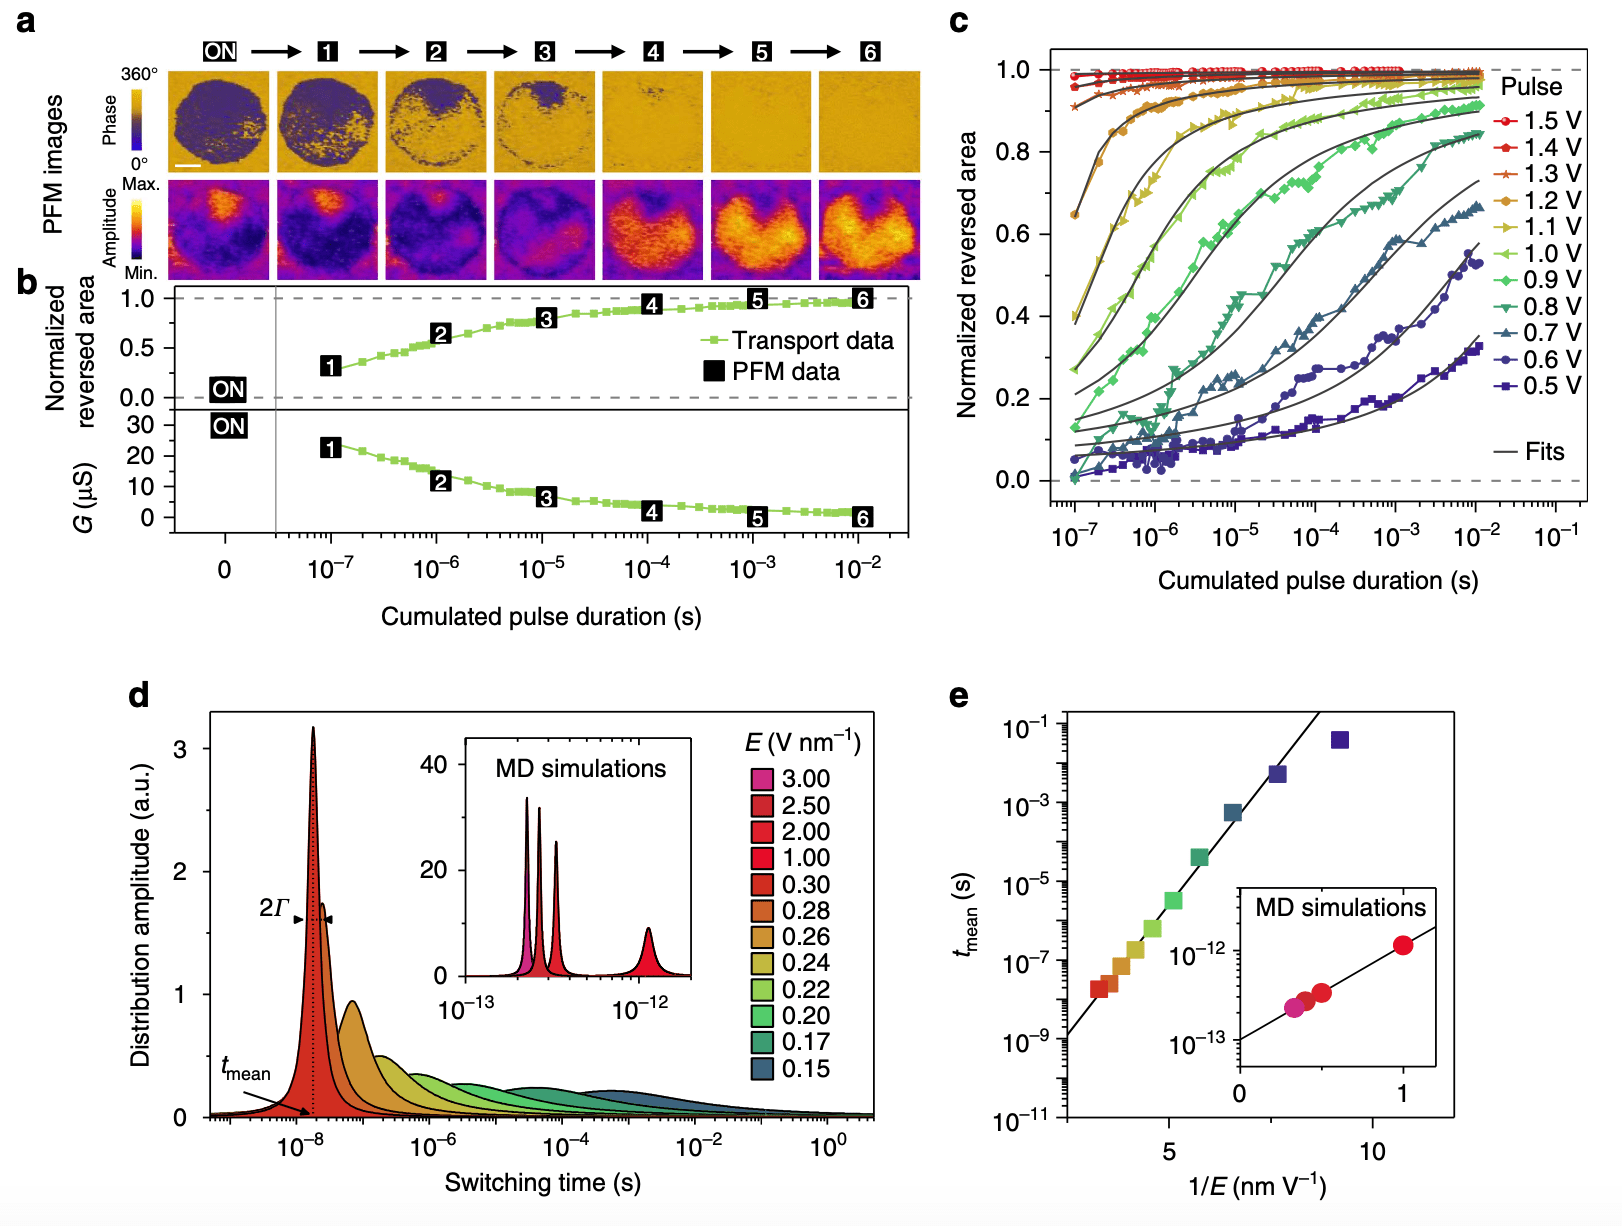
A memristor governed by nucleation-limited ferroelectric domain switching. (a) Evolution of the PFM phase and amplitude signals of a ferroelectric memristor under cumulated pulses of 1 V and 100 ns. Cumulative pulses induce a progressive switching with multiple nucleation areas and limited propagation of ferroelectric domains from up (dark phase) to down (bright phase) polarization. The scale bar is 50 nm. (b, top) Normalized switched area as a function of cumulated pulse time calculated from time-dependent transport measurements of a ferroelectric memristor. The black squares indicate the normalized switched area obtained from the PFM measurements in a. (bottom) Corresponding conductance (G) evolution measured as a function of cumulated pulse time. (c) Normalized switched area as a function of cumulated pulse time calculated from time-dependent transport measurements of a ferroelectric memristor at different pulse amplitudes. The black lines are fit results from the nucleation-limited switching model. (d) Examples of Lorentzian distributions of switching times extracted from the fits in c at different pulse amplitudes and (inset) from the MD simulations (Supplementary Fig. 2). (e) Evolution of the switching time (tmean) as a function of the inverse of the electric field (1/E) obtained from fits of the transport data in c and (inset) from MD simulations.
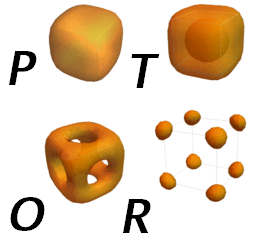
Topology of internal states manifolds in paraelectric (P), tetragonal (T), orthorhombic (O) and rhombohedral phases of BaTiO3.
Spin configurations yielding the strongest ferroelectric polarizations for GdFeO3.
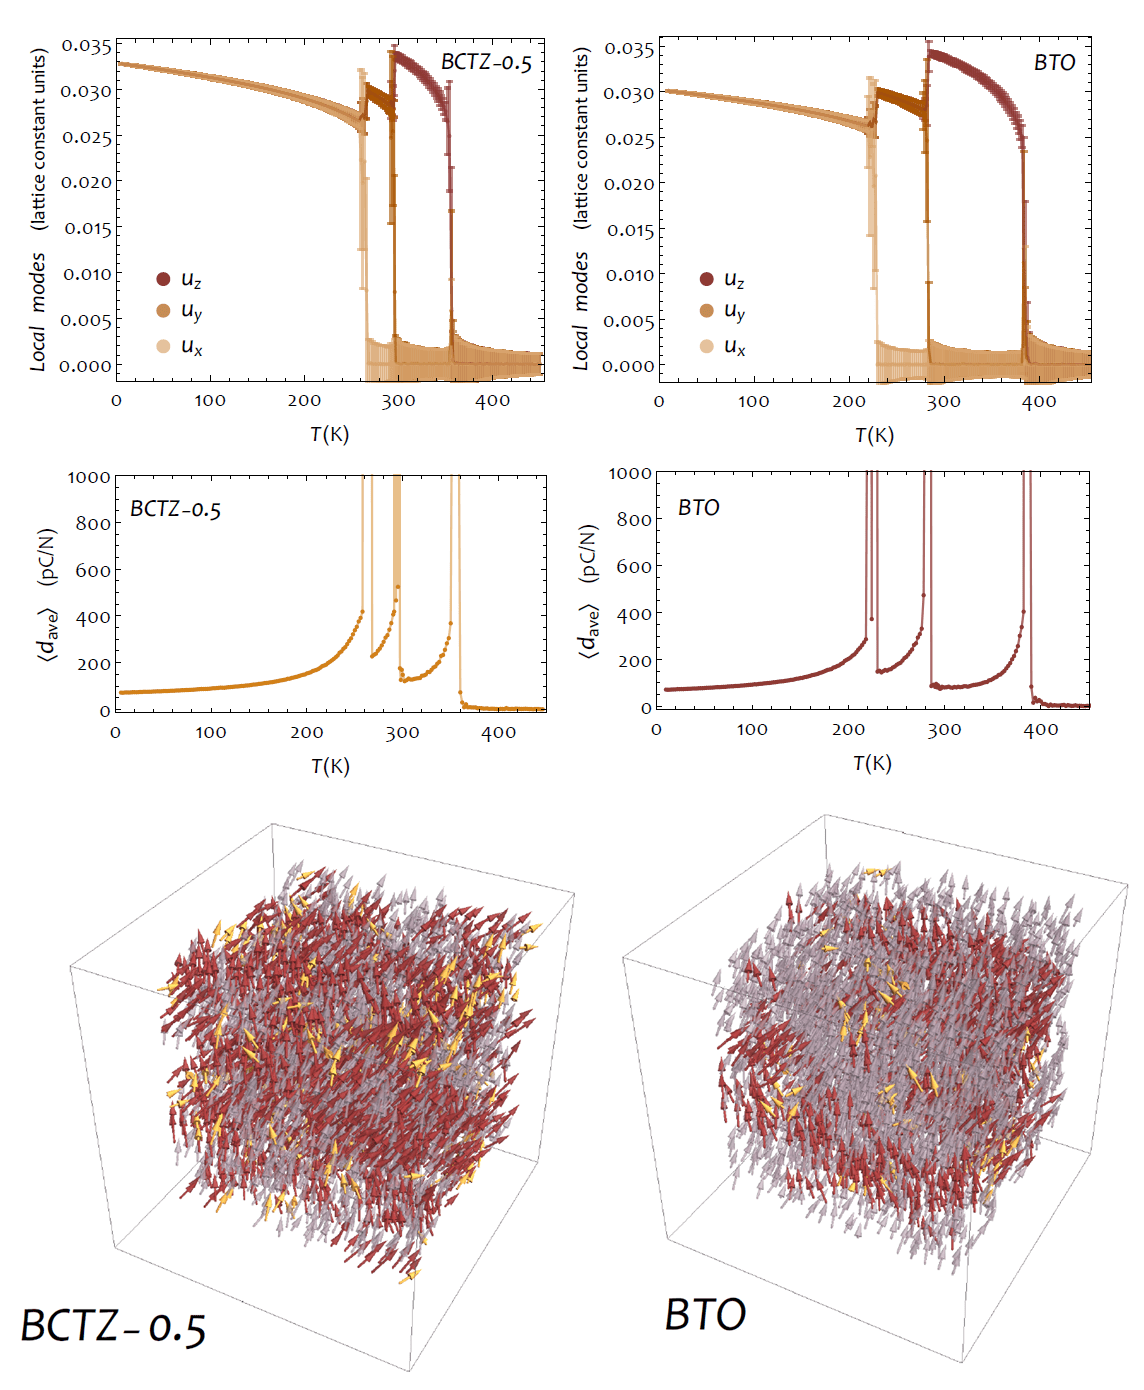
Evolution with temperature of the supercell average of the local modes (in lattice constant units) and of the average piezoelectric coefficient within (1−x)Ba(Zr0.2Ti0.8)O3−x
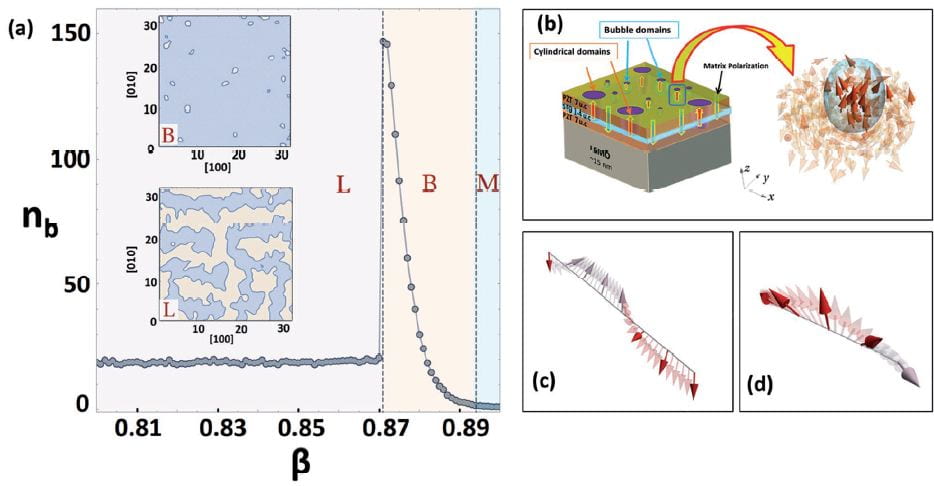
Calculated room-temperature phase diagram of PZT thin films under residual depolarising field (panel (a)) showing the stability ranges of the polar bubbles (B), labyrinth domains (L) and the monodomain state (M). The right panels show the dipolar structure of bubble domains (panel (b)) that exhibit both Bloch-like and Neel-like dipolar rotations (panels (c) and (d), respectively).
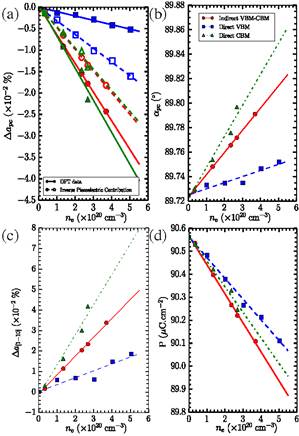
Dependence of various properties on the ne concentration of electrons excited in the conduction band states for the direct VBM (blue lines and data), the indirect VBM-CBM (red lines and data), and the direct CBM cases (green line and data), as predicted by the ΔSCF method. Panel (a) shows the relative change in pseudocubic lattice constant. Panel (b) reports the change in pseudocubic angle for the three transitions. Panel (c) shows the relative change in lattice constant along the [11–0] direction. Panel (d) shows the change of electrical polarization. Lines in all the panels are linear fits of the data (indicated by symbols). The open symbols and dashed lines in (a) display the estimated change of lattice constant arising from the inverse piezoelectric effect (see text).
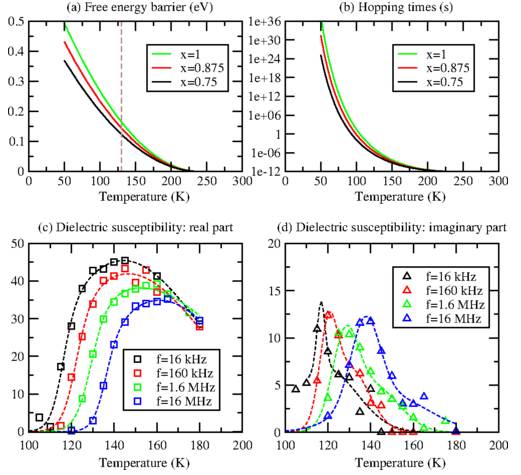
Upper panels: (a) local free-energy barriers ΔFloc(T;x) (eV) and (b) hopping times τ(T;x)=τ0e+ΔFloc(T;x)/kBT (s) as a function of temperature for the three Ti-richest blocks (x=1, x=0.875, and x=0.75). Lower panels: temperature evolution of χ′ and χ‘‘. (c) Dielectric susceptibility: real part. (d) Dielectric susceptibility: imaginary part. In panel (c), the lines correspond to a fit according to Ref. [42]. In panel (d), the lines are guides for the eyes.
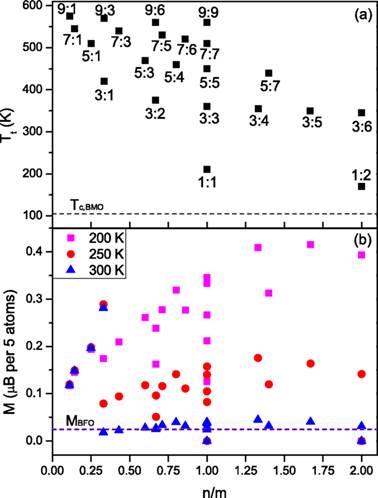
(a) Magnetic ordering transition temperatures for the set of superlattices. The results are ordered according to the ratio n/m for each (BFO)m:(BMO)n SL with m:n shown in the panel. (b) Computed magnetization at three different temperatures, for the same superlattices as shown in (a). The horizontal dashed line in (a) and (b) shows the Curie temperature of pure BMO bulk and the magnetization of BFO thin film, respectively, for comparison.
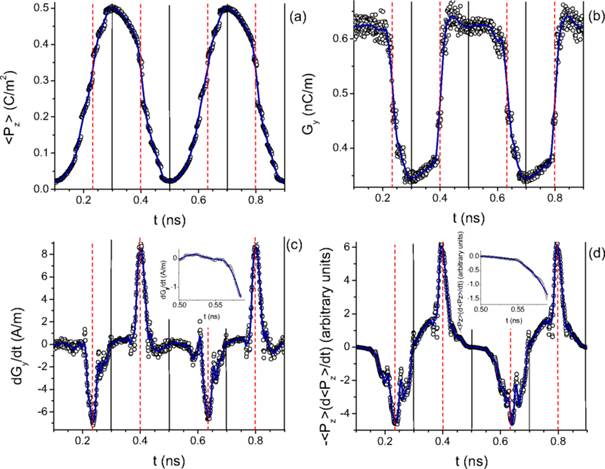
Time-dependency of the electric polarization (a), electric toroidal moment (b), time derivative of the electric toroidal moment (c), and (minus) the product of the macroscopic polarization and its time derivative (d) in the studied PZT film being under the ac electric field described in the text. Solid vertical lines mark the position of the extrema of the polarization (which coincide with those of the electric field), while dashed lines correspond to the time associated with the pulses in the time-derivative of the electrical toroidal moment. In Panels (a) and (b), the dot symbols represent the MD data, while the solid lines are fittings of such data. These fittings are then used to obtain the curves shown in Panels (c) and (d).
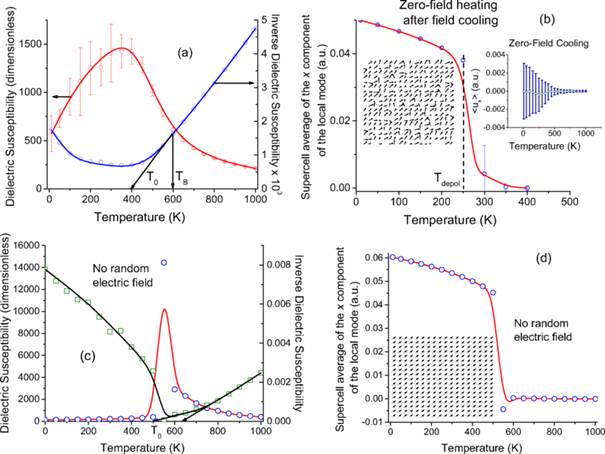
Temperature dependence of the dielectric susceptibility and its inverse, when cooling down the disordered PbMg1/3Nb2/3O3system under no electric field. TB and T0 correspond to the Burns temperature and the temperature extrapolated from the Curie-Weiss law at high temperatures, respectively. The inset shows the x-component of <u>, when the system is cooled under no field. The error bars are those arising from computing averages over 30 different chemical configurations.
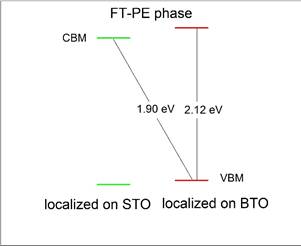
Schematization of the band alignment for the PT-PE phase at 425 K (Panel a) and for the FT−PE phase at 165 K (Panel b), respectively.
Pressure dependence of the enthalpy of the Pv-Pnma, pPv-Cmcm, and ppPv-Pnma phases of NaMgF3 (a), along with the schematization of (b) the Pv-Pnma, (c) pPv-Cmcm, and [(d) and (e)] ppPv-Pnma crystal structures. Note that the enthalpy of the Pv-Pnma phase has been set to be zero for any pressure in (a), and that the inset in (a) displays the behavior of the volume vs pressure in the Pv-Pnma, pPv-Cmcm, and ppPv-Pnma phases (in the pressure ranges they have the lowest enthalpy).
Stability of the skyrmionic state. (a) Polarization field configuration within the relaxed skyrmionic state (Sk) as obtained from the simulation at 15 K. (b) Local dipoles plotted along a line passing through the skyrmions core and parallel to the x coordinate axis. It is seen that the tips of the dipoles describe a circle in the plane perpendicular to the line, thus indicating the variation of the y and z components along this line. The vectors are coloured according to their z-component in a,b. (c) Dependence of the internal energy de on the Pz component of polarization showing the crossover between two stable minima: the one corresponding to the (Vxy|FEz) state characterized by a vortex pattern in the z-planes co-occurring with an electrical polarization along the [001] direction, and the one associated with the skyrmionic texture (Sk). Error bars indicate s.d. (d) Temperature dependence of the estimated threshold external electric field E* needed to drive the system towards the skyrmion state.
Figure 4. The five-state switching mechanism for (BiFeO3)1 /(NdFeO3)1 superlattice. a,b) The local modes (upper panel: u_Γ ; lower panel: u_x characterizing ferroelectricity and antiferroelectricity, respectively); c) oxygen octahedra tilting vectors (ω_R and ω_M characterizing anti-phase and in-phase tiltings, respectively); d) the AFM vector; and e) the weak FM vector under a sequence of applied electric fields, i.e., 1) an increasing field along the [110] direction (perpendicular to the initial polarization); 2) field removed; 3) an increasing field along the [110] direction (antiparallel to the initial polarization); 4) field removed. The insets show schematics of the five-state switching mechanism.
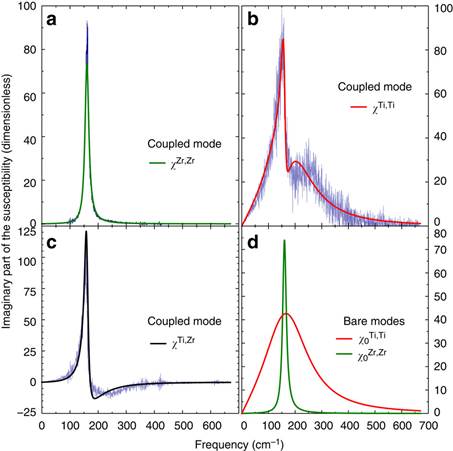
(a–c) The dielectric responses from Zr cells, χZr,Zr, from Ti cells, χTi,Ti, and from the cross-correlation between Ti and Zr cells, χTi,Zr, which include the coupling between the bare responses of Ti and Zr sublattices. (d) The bare dielectric response from Zr cells, χ0Zr,Zr and bare dielectric response from Ti cells, χ0Ti,Ti. The actual MD data are also shown (in blue colour) in order to confirm that Fano interference leads to the main striking features adopted by χTi,Ti and χTi,Zr. The parameters entering this interference are found by simultaneously fitting the MD data of χTi,Ti and χZr,Zr using![]() and
and ![]() .
.
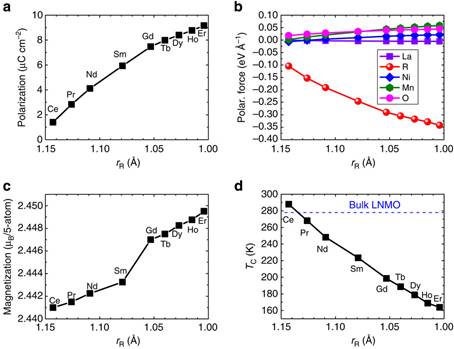
(a,c,d) The predicted electric polarization (as computed from Berry phase), magnetization (at T=0 K) and paramagnetic-to-ferromagnetic transition temperature (as calculated by Monte Carlo simulation) in the relaxed P21 ground state of the superlattices, respectively. (b) The average forces (along the b direction) on La3+, R3+, Ni2+, Mn4+ and O2− ions in the unrelaxed state of the R2NiMnO6/La2NiMnO6 superlattice, for which the lattice parameters and atomic coordinates are those of the paraelectric P21/n state of La2NiMnO6 and for which the R ions occupy the second AO layer of Fig. 1a. The blue horizontal dashed line in d represents the magnetic Curie temperature of La2NiMnO6 bulk. As evidenced in Supplementary Fig. 2, the error bar of the paramagnetic-to-ferromagnetic transition temperature can be estimated to be about 6 K. Moreover, an error bar of polarization can be estimated by comparing the results of the relaxed structure of the Er2NiMnO6/La2NiMnO6 superlattice when using U=3 eV and U=5 eV. It is found to be as small as 1% (which corresponds to a variation of the polarization from 9.16 to 9.26 μC cm−2).
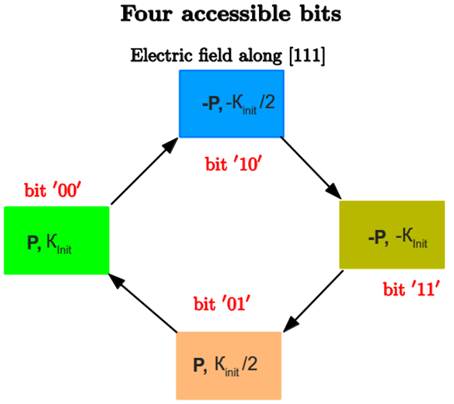
Schematization of the proposed four-state memory.
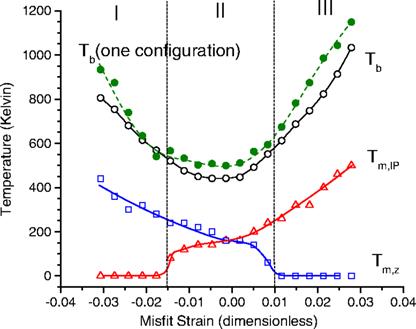
Dependency of the critical temperatures on misfit strain, in epitaxial BZT films (as averaged over 20 different realizations of disorder). The open circles, triangles, and squares are numerical data for Tb, Tm,IP, and Tm,z, respectively, while solid lines are guides for the eyes. The vertical dashed lines delimit the regions I, II, and III indicated in the text. The error bars on the numerical data are estimated to be around 50 K. The Tb temperatures associated with a single atomic configuration (which is chosen among the studied 20 realizations of disorder), is also shown by filled circles and a dashed line, to emphasize the effect of atomic distribution on physical properties of BZT systems and the need to average over different configurations to model complex disordered material.
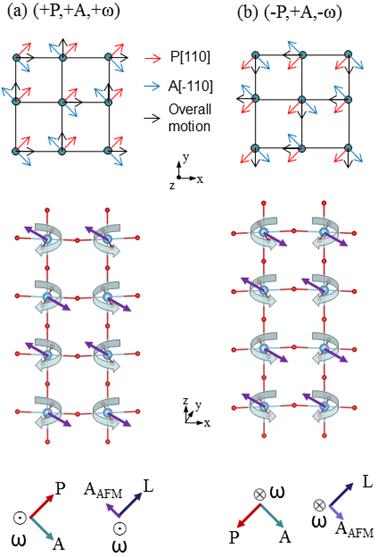
Schematization of properties in the equilibrium (P, A, ω) state (left panels) and (−P, A, −ω) phase (right panels). The upper panels display the zigzag motions of Bi atoms in an (x, y) plane. The middle panels show(i) oxygen octahedral tiltings (represented by curled arrows), (ii) magnetic dipoles associated with the weak A-type antiferromagnetic vector (purple arrows) and with the predominant G-type AFM vector (represented by green arrows), and (iii) Bi displacements that are associated with AFE (light blue arrows). The lettering “Fe” (respectively, “Bi”) indicates the iron (respectively, bismuth) ion whose location serves as the origin for the definition of the ω, G, and AAFM (respectively, A) vectors. The lower panels schematize the directions of P, the AFE vector, the AFD vector, the G-type AFM vector, and the weak A-type AFM vector.
Schematic representation of two simple AFD patterns, indicating with arrows the displacements affecting the oxygen atoms. The oxygens that get closest to the central A cation are marked with asterisks; in (b), there are two symmetry-inequivalent cases, marked with single and double asterisks, respectively.
Schematic of the quantities involved in the derivation of the formula associated with the spin-current mode.
Snapshots of the dipolar configurations in a given (y, z) plane for different electric fields applied along [111] in disorderedBaeZr0:5Ti0:5 TO3 solid solutions, at 10 K. Panels (a), (b), (c), (d), (e), and (f ) correspond to the field’s magnitude of 0 V=m (region I), 3×10⁷ V=m (regions I/II), 8×10⁷ V=m (region II), 1.2×10⁸ V=m (region III), 1.7×10⁸ V=m (regions III/IV), and 2.0×10⁸ V=m (region IV), respectively. Green color (small arrows) indicates that the local modes are centered on Zr ions. Blue and black colors (large arrows) indicate that the local modes are centered on Ti ions, and that the corresponding x component of these local modes are negative and positive, respectively. Red color (solid line) is used to delimit PNRs. The clusters appearing in panel (a) are denoted by numbers varying between 1 and 8.
“Crafting the magnonic and spintronic response of BiFeO3 films by epitaxial strain”
D. Sando, A. Agbelele, D. Rahmedov, J. Liu, P. Rovillain, C. Toulouse, I. C. Infante, A. P. Pyatakov, S. Fusil, E. Jacquet, C. Carrétéro, C. Deranlot, S. Lisenkov, D.Wang, J-M. Le Breton, M. Cazayous, A. Sacuto, J. Juraszek, A. K. Zvezdin, L. Bellaiche, B. Dkhil, A. Barthélémy1 and M. Bibes, Nature Materials 12, 641–646(2013).
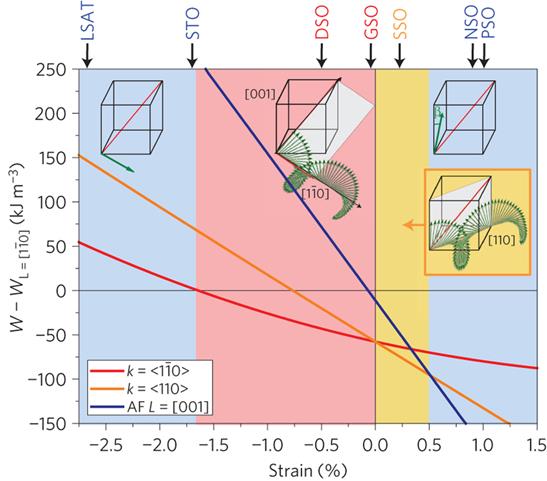
The energy of three magnetic states (bulk-like ‘type-1’ cycloid with propagation vector along [1-10] directions, ‘type-2’ cycloid with propagation vector along (110)directions, and collinear antiferromagnetic order with antiferromagnetic vector close to [001]), relative to a fourth magnetic state, corresponding to a collinear antiferromagnetic order with antiferromagnetic vector along in-plane [1-10] directions. The stability regions of the different states are shown in colours (blue: antiferromagnetic; red: type-1 cycloid; orange: type-2 cycloid). The different substrates used are located on top of the diagram at their corresponding strain. Their colour corresponds to the magnetic state determined from the Mössbauer measurements. The sketches represent the different magnetic states, with spins shown in green.
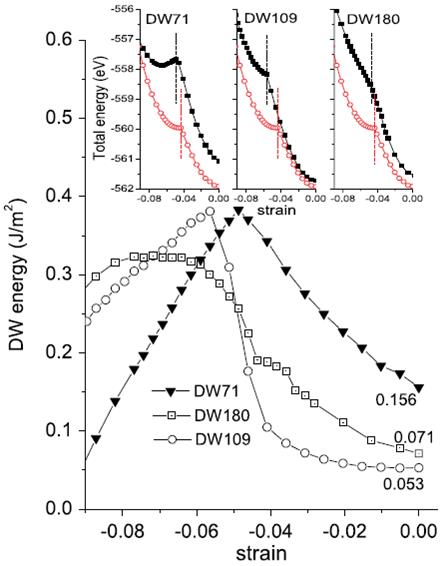
Dependence of domain wall energies on the in-plane epitaxial strain for the investigated multidomain structures. The insets show the minimum total energy of the MD structures (in solid black squares) and SD configurations (via open red circles) as a function of the misfit strain. In these insets, the vertical dashed lines delimit the strain regions for which the MD structures adopt an R-like phase while the SD configuration has already transformed into its T phase.
Predicted hysteresis loops in the studied nanocomposite at 15 K for a frequency of 1 GHz. Panels (a) and (b) showthe electrical toroidal moment and polarization, respectively, as a function of the value of the ac electric field.
Predicted total energy of theG-typeAFM state [panel (a)] and energy difference between the G-type AFM andFMstates [panel (b)] versus the misfit strain for low-in-energy phases in epitaxial (001) ETOfilms. The inset of panel (a) displays a schematic of the a_a_cm-type nanoscale twinned phases possessing the mmmppp tilting pattern. In this inset, the curled and straight arrows represent oxygen octahedra tilting about [001] or [00_1] and antiferroelectric Eu displacements, respectively. The different tilting angles about [001] are also provided here.
Predicted local properties of epitaxial (001) [PTO]3/[BFO]3 superlattice versus the in-plane lattice parameter in the equilibrium phases. (a) and (b) Show the x component (which is identical to its y component) of the local effective polarization and the z component of the local formal polarization in the six cells. Panels (c) and (d) display the x component (which is identical to its y component) and the z component of the cell-by-cell decomposition of the AAFD vector in the six cells , respectively. The inset of (d) represents the in-phase octahedra tilting in the six cells, the effective polarizations of BFO and PTO cells are shown by means of vertical arrows.
Schematic of the nanoscale twinned octahedral tilting structures found by first-principle calculations. a,b) The ppmppm and ppmm patterns, respectively. The straight arrowsrepresent the antiferroelectric Bi displacements (that are oriented along the [110] or [-1-10] pseudo-cubic directions), while the curled arrows indicate if the displayed oxygen octahedraltilting is counterclockwise or clockwise.
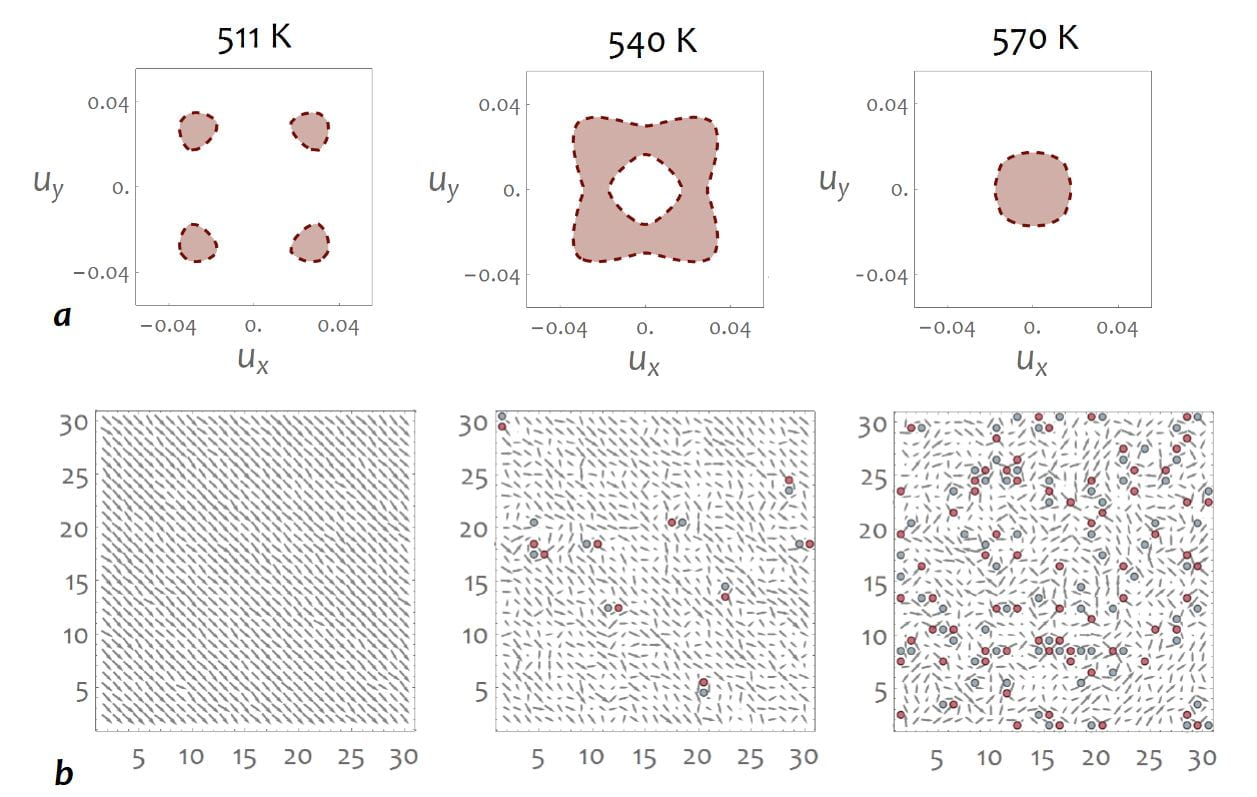
Snapshots of the dipolar configurations in a given (y, z) plane for different temperatures. Panels (a), (b), (c), (d), (e), and (f ) correspond to temperatures of 550 K (Region I), 250 K (Region II), 150 K (Region III), 100 K (Region IV), 50 K (Region IV) and 10 K (Region IV), respectively. Blue colors and red colors indicate that the corresponding local modes are centered on Ti and Zr ions, respectively.
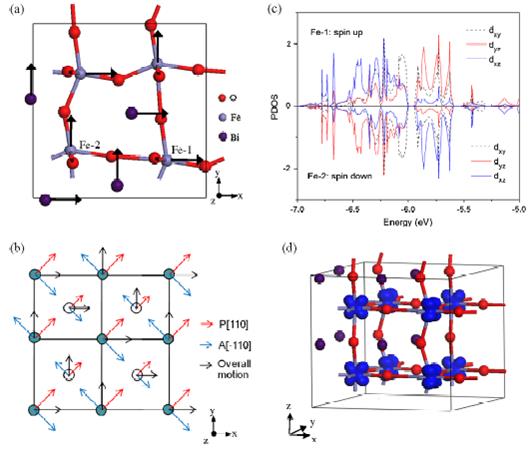
Features of the Pmc21 state of BFO. Panel (a) displays atomic characteristics and emphasizes the inhomogeneous in-plane displacements of the cations. Panel (b) schematizes these displacements in terms of the sum of a polar and antiferrolectric distortion. Panel (c) shows the partial density of states related to the dxy, dyz, and dxz orbitals of two Fe ions belonging to the same (001) layer. Panel (d) shows the C-type ordering between the dyz and dxz orbitals of Fe ions in the BFO films. In panel (b), the Bi (respectively, Fe) atoms are indicated by filled (respectively, open) circles, and the Bi and Fe atoms belong to different (001) planes.
Ferromagnetic (F) and antiferromagnetic (G, C and A) vectors for different oxygen octahedra tilting arrangements and different resulting paraelectric phases in BiFeO3 bulks, as predicted by first principles. The chosen ωR and ωM AFD vectors are provided in the first two columns. The asterisk indicates the primary magnetic vector. Each different case is referred to by an integer that is indicated at the beginning of each row. The magnetic vectors are expressed in units of Bohr magneton per Fe ion. The AFD vectors are indicated in radians. Glazer notations are used to describe the tilting arrangements of the oxygen octahedra.
Features of the different phases found in the studied nanocomposite for different temperature regions. Panels (a)–(d) show dipolar patterns that are characteristics of Phases I, II, III and IV, respectively (see text). In each panel, the left part shows the pattern adopted by the x- and y-components of the dipoles in the (001) plane indexed by z = 6, while the top (respectively, bottom) right part displays the configuration for the x- and z-components (respectively, y- and z-components) of the dipoles in the (010) plane indexed by y = 27 (respectively, (100) plane indexed by x = 27). In the left parts, the wires boundaries are indicated by black dashed lines and the vortices within those wires are indicated by red dots, while the vortices and antivortices of the medium are highlighted by blue dots and green crosses respectively. In the right part of Panel (a), zigzag chains are emphasized via dashed lines. Panel (e) schematizes the dipolar pattern of Phase I and provides the decomposition of its total (zero) winding number. Panel (f) represents the motion of the vortex core in one wire (namely, the one shown in the bottom right part of the left side of Panel (a)) at T = 5 K. The rotating in-plane polarization is also shown there. The magnitude of this rotating in-plane polarization is about one order smaller than the homogeneous out-of-plane polarization.
Complex electric (a) and magnetic (b) susceptibilities as a function of frequency in BFO at T = 20 K.
The isotropic dielectric response of the PbZr0.47Ti0.53O3 solid solution versus frequency, at (a) 600 K and (b) 400 K. The insets show the εzz dielectric response, where z corresponds to the direction of the polarization. Solid and dotted lines represent the real and imaginary
parts, respectively, of such complex dielectric responses.
Electrical toroidal moment (a), AFD related quantity ω (b), AFM vector (c), and magnetization (d) as functions of the magnitude of the S vector applied along the[-1-10] direction.
Atomic features of the predicted P212121 state. Panel (a) displays the crystallographic structure. Panels (b), (c) and (d) schematize the Bi displacements associated with the projection of gM, gX and of the sum of these two latter order parameters, respectively, in a pseudocubic(010) plane.The green (respectively, blue) arrows/circles are used to emphasize a ferroelectric vortex (respectively, antivortex).
A 10 K pattern of the electric dipoles (a) and AFD vectors (b) in a (y; z) plane for the aacd [Raac] state of the 4.8 nm-thick PZT film under a compressive strain of -0.25%, as mimicked by a 12x12x12 supercell.The “cylindrical chiral bubbles” formed by the electric dipoles are highlighted by means of ovals in (a). The dipolar waves are also highlighted by means of a solid line in (a). The arrows ‘‘up’’(blue) and ‘‘down’’ (red) refer to the z component of the dipoles or AFD vectors being positive or negative, respectively.
Frustrated ground-state microstructure and dipolar orientational correlations in phase II. a, Ground-state dipolar configuration. Blue, positive dipole z component; red, negative dipole z component. b, Bending of lines, curvature and herringbone patterns in the microstructure are indicated by solid black lines. Selected z chains are highlighted and some ‘topological defects’ are circled. c–e, Orientational correlation functions. For the blue curves the first dipole (used to compute these correlation functions) belongs to an up z-chain, and for the red curves it belongs to a down z chain. f, Dipoles forming the herringbone pattern (black lines in b).
10 K pattern of the ui local mode vectors [panel (a)] and Ωi AFD vectors [panel (b)] in a (X, Z) plane for the equilibrium 71°domains of the 8 nm-thick film.
Effective Hamiltonian results evaluated in a BFO film, at 300 K and vs misfit strain, (a) tetragonality (c/a ratio), and (b) antiferrodistortive angles ω along x, y, and zaxes (ωX and ωY, red, and ωZ, blue). (c) Theoretical results on BFO film transition temperatures (TC, blue, and TN, green) as a function of misfit strain. The activation temperatures for the antiferrodistortive oxygen tilting along z direction (tetragonal distortion T001, black), for the antiferrodistortive oxygen tilting within thex-y plane (orthorhombic distortion T110, red), and for the tilting along [uuv] direction (monoclinic distortion Tuuv, orange) are also plotted.
Structural patterns in a (001) plane at 10 K, for a PZT nanodot under OC conditions possessing a Ti composition of 51% and having a lateral size of 2.4 nm. (a) local dipoles. (b) antiferrodistortive motions ωi. (c) Ωi= (-1) nx(i)+ny(i)+nz(i) ωi. Panels (d), (e), and (f ) represent similar data, respectively, but for a BFO nanodot of lateral size of 4.8 nm and in a (110) plane. Such unusual collective behaviors occur for any lateral size larger than 1.6 nm. (1), (2), (3), and (4) refer to the four domains mentioned in the text, and involved in Eq. (3) via the mindex. Planes located just above or below the presented planes exhibit the same configuration for the electric dipoles and the_ivectors (reflecting the fact that the tilting of the oxygen octahedra are associated with theR point in PZT and BFO bulks).
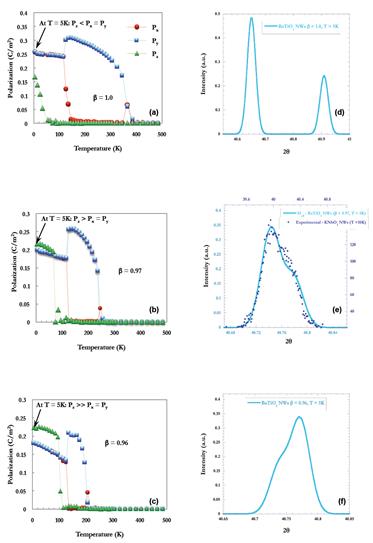
Left: Cartesian components of the polarization Px, Py, and Pz (in C/m2) as a function of temperature in BaTiO3 with rectangular cross-section of 7.2 × 7.2 Å2(as mimicked by a 18 × 18 × 12 supercell) under (a) perfect SC, where β = 1, and partial screening (b) with β= 0.97, and (c) with β = 0.96 conditions. The infinite direction of the wire is along the z-axis. The x-, y-, and z-axes are chosen along the pseudocubic [100], [010], and [001] directions respectively.
Right: Calculated XRD (200) Bragg peaks for BaTiO3 nanowires at 5K under (d) perfect SC, for which β = 1, and partial screening with (e) β = 0.97, and with (f) β = 0.96. The solid lines show such predicted XRD peaks while Fig. 4(e) also displays the experimentally obtained peaks for KNbO3 nanowires at 10K by means of dots’ symbols.