
Some older studies:
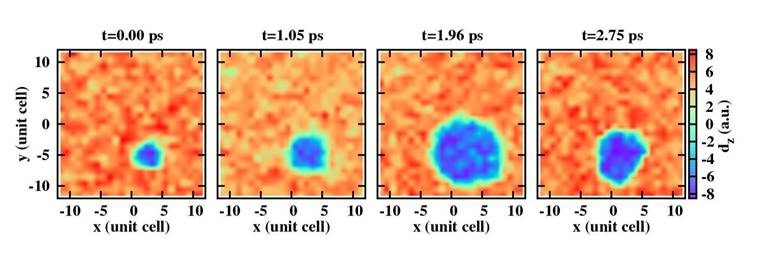
Snapshots at different times of a (x, y) cross section of the dipole pattern in a PZT film initially possessing low-density nanobubbles (pattern III). This cross section corresponds to the most inner (001) B plane, and the x and y axis lie along the [100] and [010] directions, respectively. Red (respectively, blue) areas show areas with dipoles pointing up (respectively, down) along the z direction. These data correspond to the intermediate strain pulse [dashed lines in Figs. 1(a) and 1(c)], and an initial nanobubble volume of 5:3 nm3.
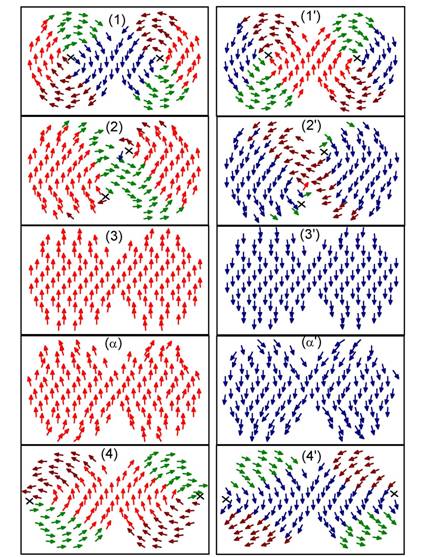
Schematization of the dipole arrangement in a (x, y) plane for magnetic states playing a key role in the reversal of the hypertoroidal moment. Crosses represent the vortex centers.
Dipole moment pz of an arbitrarily chosen unit cell as a function of time in MD simulations at T=TC-10K. The inset shows the 8 possible off-center Ti sites. The Ti ion mostly fluctuates around and among the 4 sites preferred by the molecular field (full circles, pz> 0). Occasionally, it also hops towards the excited site (dashed circles, pz<0). These hops correspond to the few negative spikes encountered on the pz trajectory.
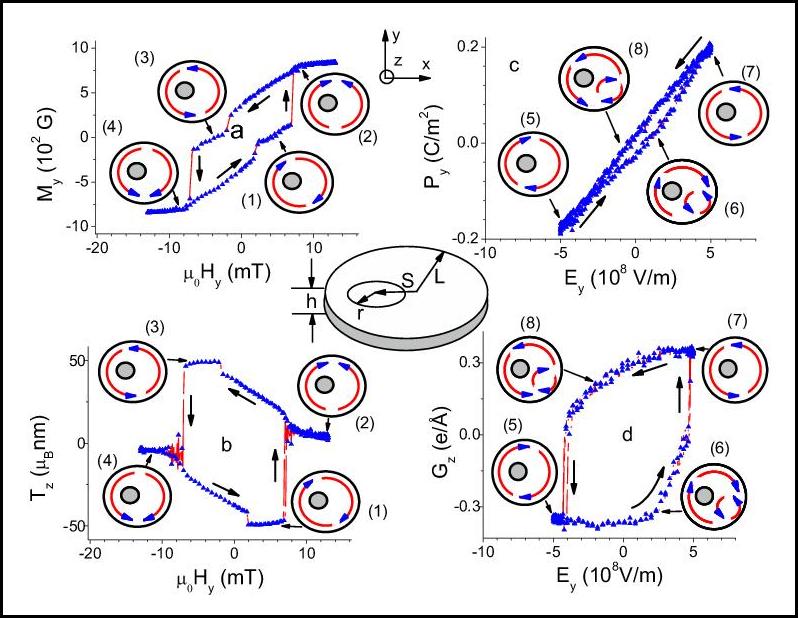
Predicted hysteresis loops in asymmetric ferromagnetic rings [Panels (a) and (b)] and in asymmetric ferroelectric rings [Panels (c) and (d)]. Panels (a) and (b) display the behavior of the magnetization and magnetic toroidal moment, respectively, as a function of the applied homogeneous ac magnetic field. Panels (c) and (d) show the evolution of the polarization and electric toroidal moment, respectively, versus the applied homogeneous ac electric field. Insets schematize the rings’ geometry and the dipole arrangement in the (x,y) plane for eight important states: vortex states (states (1), (3), (5), and (7)), onion states (states (2) and (4)), and antiferrotoroidic pair states (states (6) and (8)).
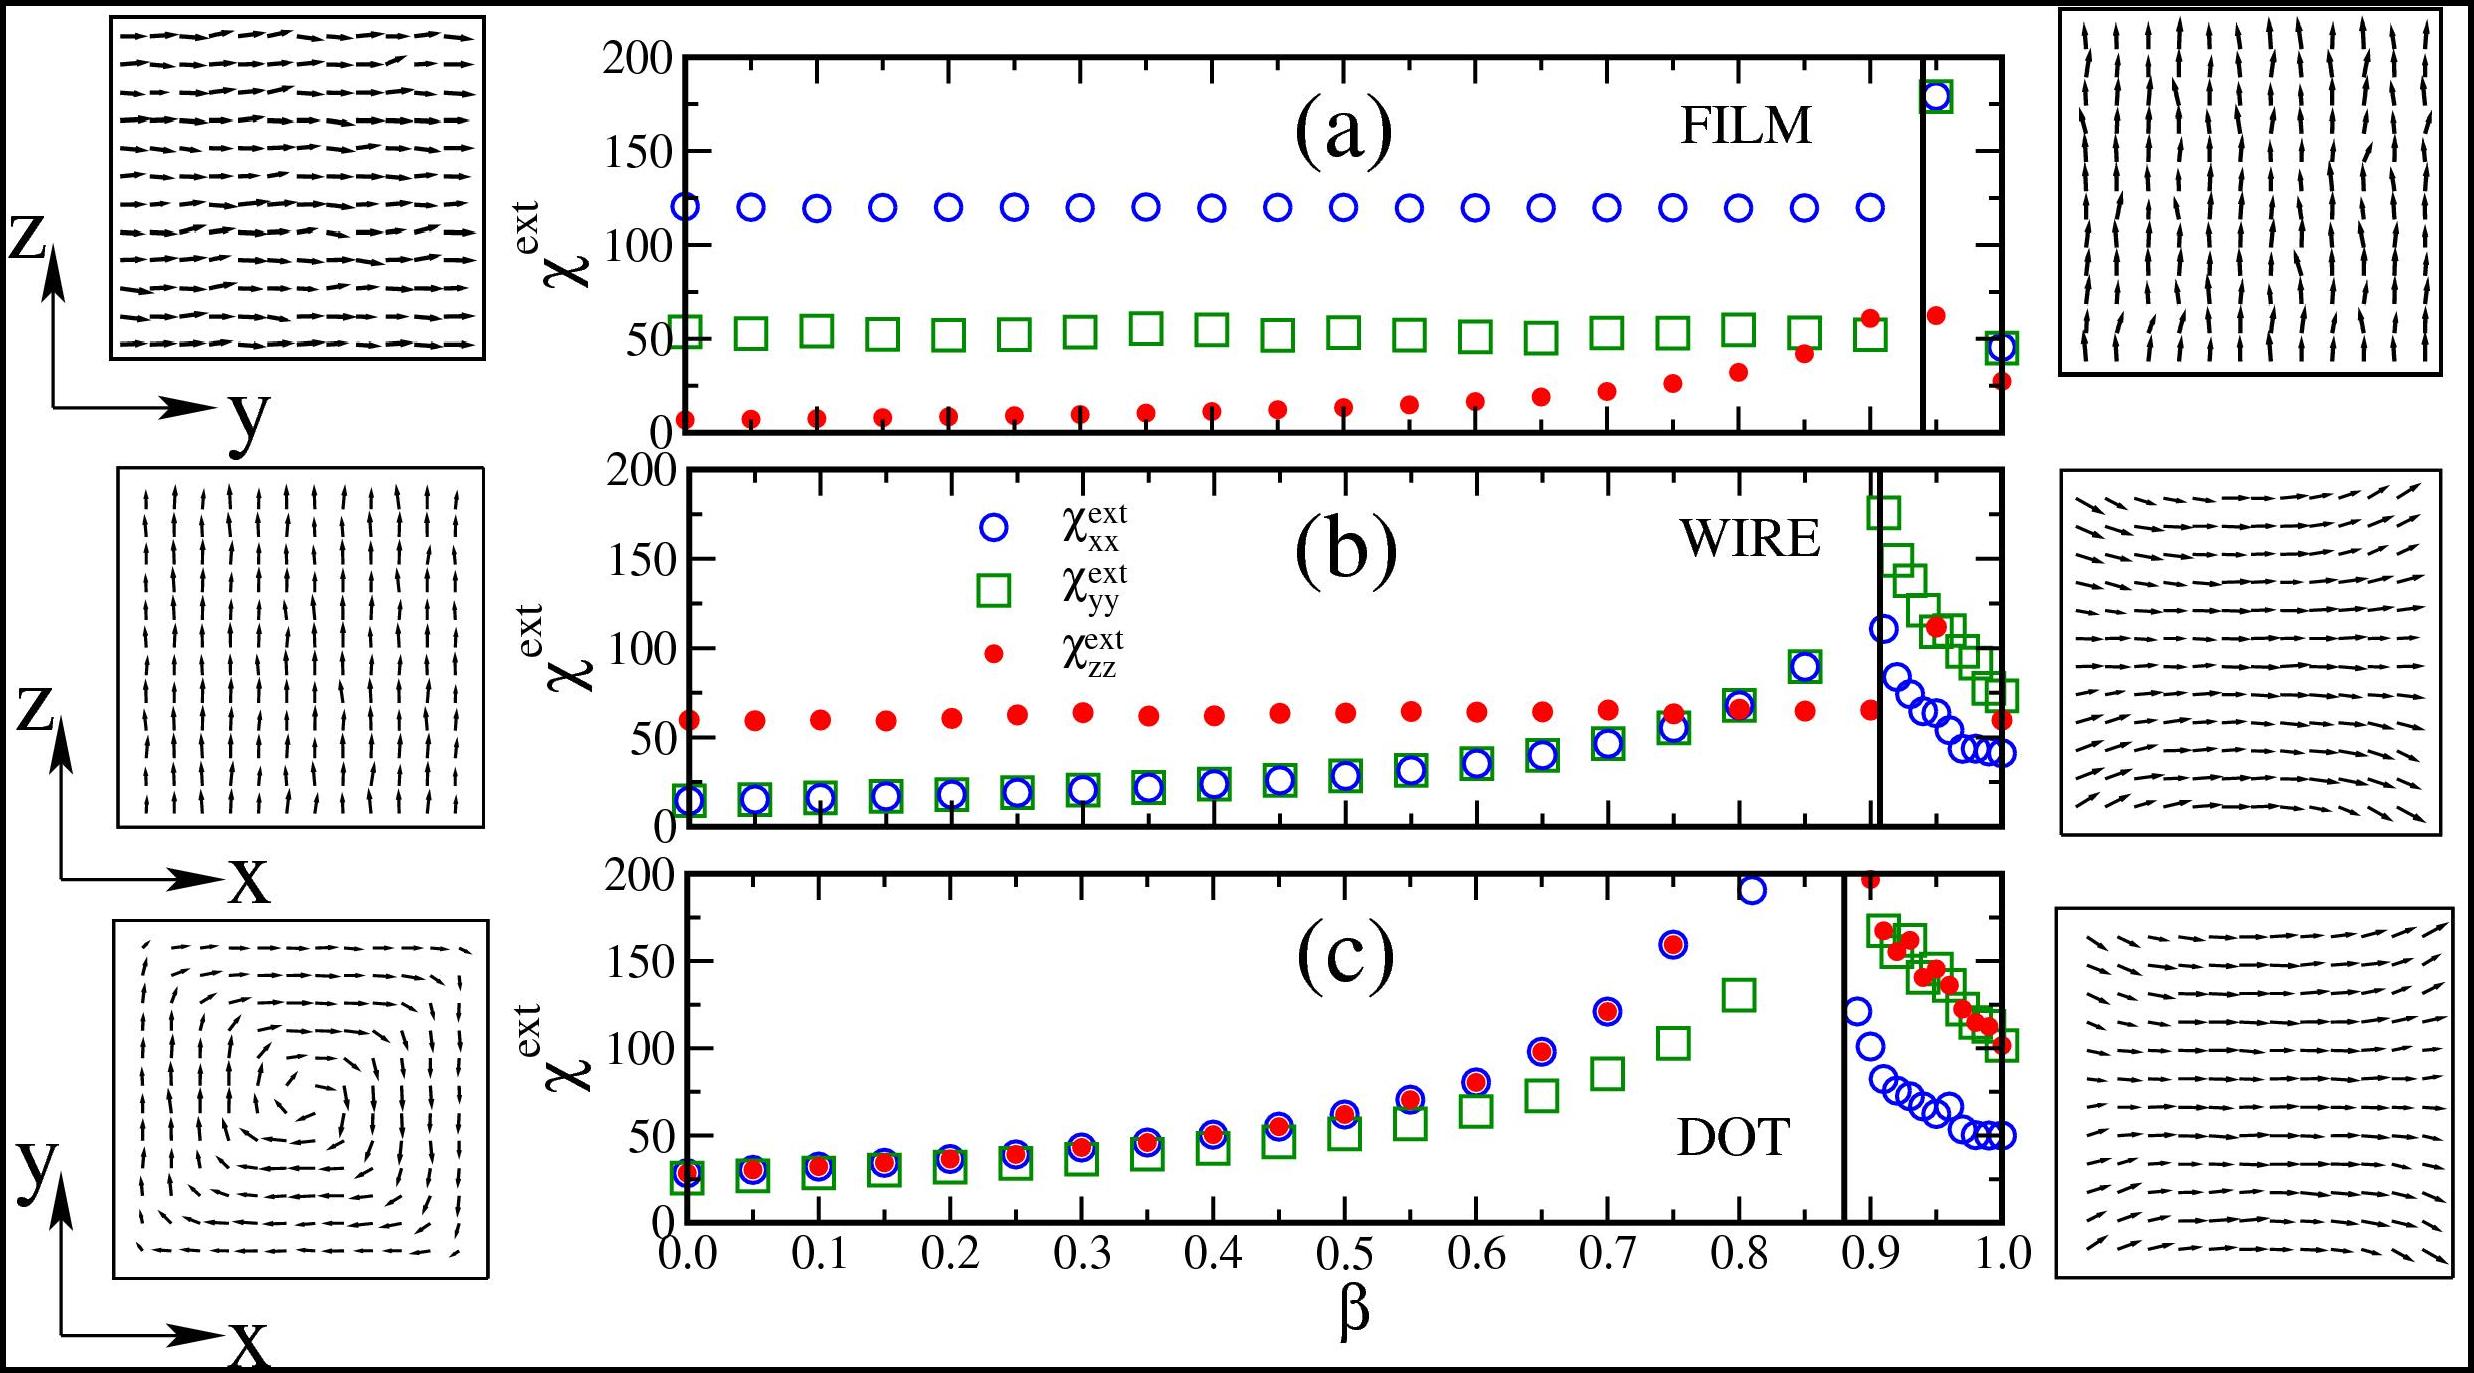
External dielectric susceptibility χext of a PZT60 film [part (a)], wire [part (b)], and dot [part (c)] vs the screening parameter β. Left and right insets show the projections of the dipole patterns in the structures under open-circuit-like and short-circuit-like boundary conditions, respectively. The vertical lines characterize the transition from short-circuit-like conditions to open-circuit-like conditions.

Internal dielectric susceptibility χintof a PZT60 film [part (a)], wire [part (b)], and dot [part (c)] vs the screening parameter β. The vertical lines characterize the transition from short-circuit-like conditions to open-circuit-like conditions. Note that χintxx(yy)=χextxx(yy) in the film, while χintzz=χextzz in the wire – since no depolarizing field exists along these directions.
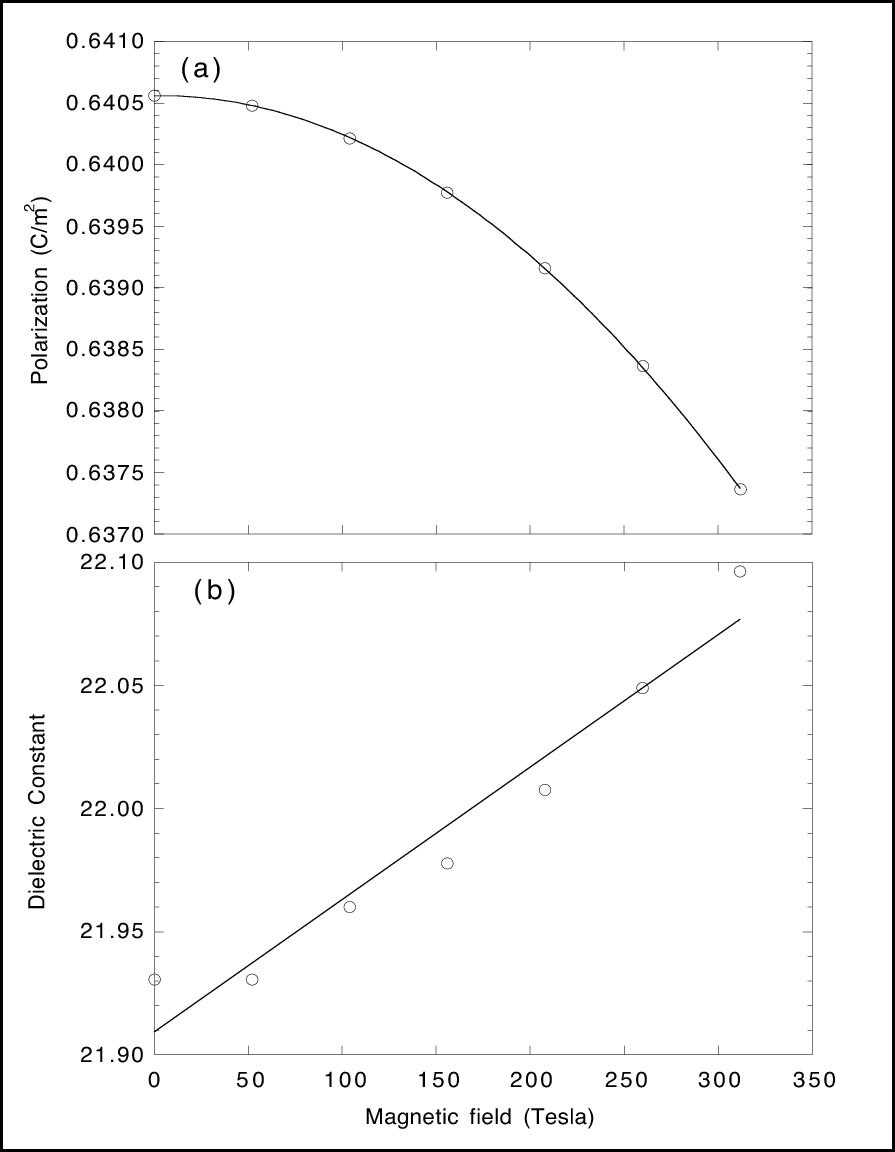
Room-temperature polarization (a) and dielectric constant (b) of BiFeO3, as a function of magnetic field and as predicted by the proposed method.
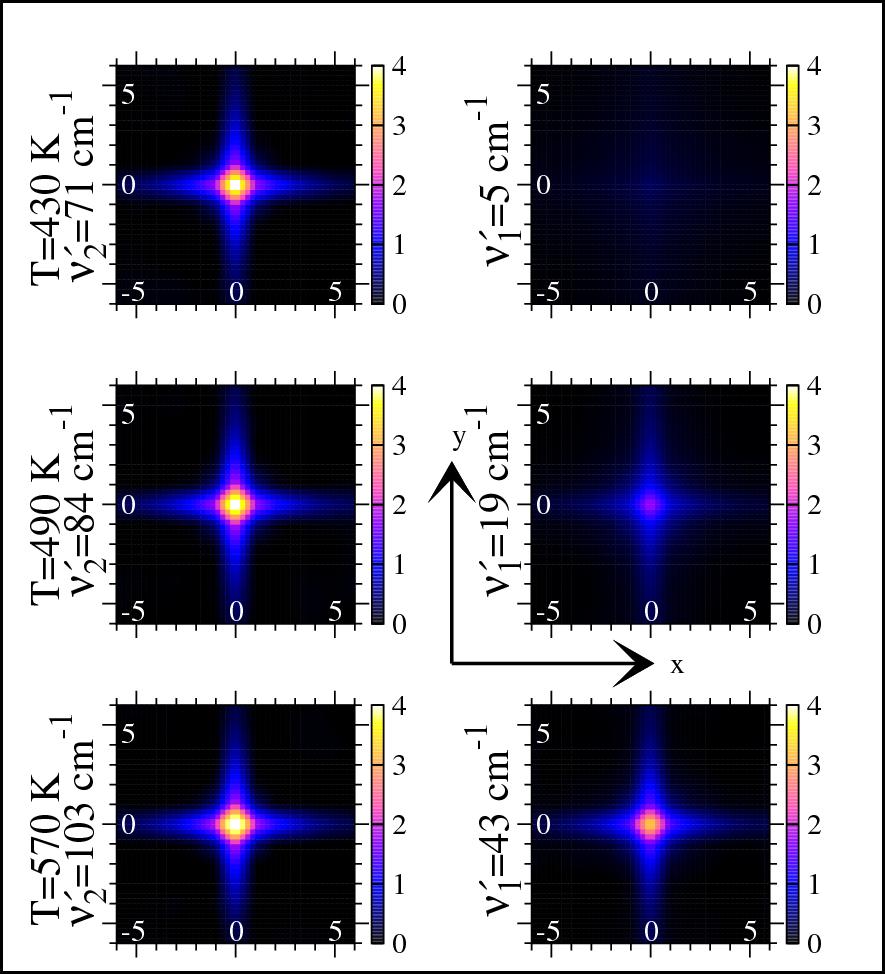
Real-space decomposition, χ”(ν=ν’i,x,y,z=0)/(ε”(ν=ν’)-1) (for i=1 and 2, expressed in percent and for three different temperatures), of the two peaks of the imaginary part of the dielectric constant. The x, y and z-axes are chosen along the [100], [010] and [001] directions, respectively, and their coordinates are expressed in terms of the 5-atom unit cell lattice’s constant (that is, a=0.39 nm).
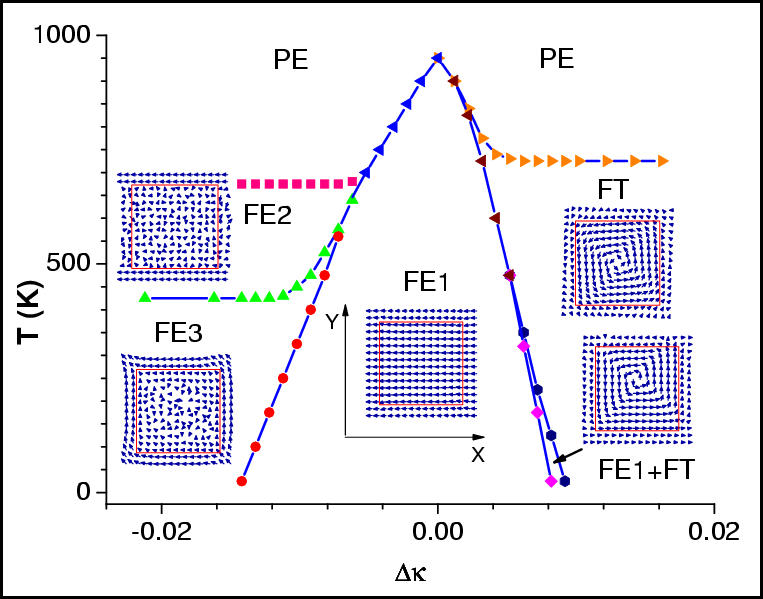
Temperature-versus-Δ&kappa phase diagram of a 12x12x12 AB”O3 dot embedded in a AB’O3 medium within a 16x16x16 periodic supercell.The positive Δκ part of this diagram corresponds to a soft ferroelectric dot immersed in a medium that is ferroelectrically harder than the dot and that has a decreasing ferroelectric instability as Δ&kappa increases. The negative Δ&kappa part of this diagram corresponds to a dot (having a ferroelectric instability that is weaker than those of the medium and that decreases, and then vanishes, as Δ&kappa increases in magnitude) embedded in a ferroelectrically-soft medium. The lines with symbols represent the phases’ boundaries. The insets show a (001) cross-section of the dipole configuration in the different phases. Specifically, these insets correspond to atomistic calculations with the following (Δ&kappa temperature) combination: (-0.0212 a.u., 1K), (-0.0212 a.u., 500K), (0.0062 a.u., 1K), (0.0087 a.u., 1 K) and (0.0112 a.u., 1K) for the FE3, FE2, FE1, FE1+FT and FT phases, respectively. The dot surfaces are indicated via thick continuous lines in these insets. The x- and y-axes are chosen along the pseudo-cubic [100] and [010] directions, respectively.
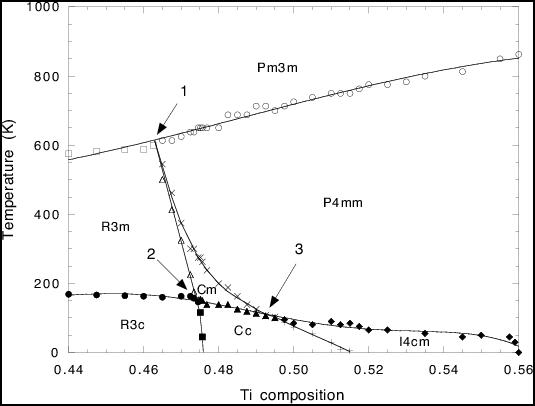
Phase diagram of Pb(Zr1-xTix)O3 near its MPB, as predicted by the present scheme with an applied pressure of -4.68 GPa. Symbols display the direct results of our simulations, while lines are guide for the eyes. Indices 1, 2 and 3 indicate the multiphase points. The uncertainty on the transition temperatures is typically around 13K, except close to the multiphase points 2 and 3 for which this uncertainty is around 3K.
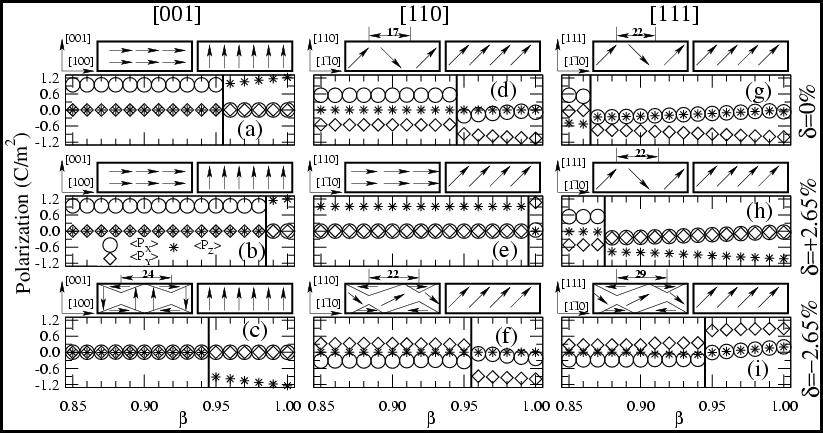
Cartesian components of the ground-state spontaneous polarization in Pb(Zr0.4Ti0.6)O3 (4.6-4.8-nm-thick) films as a function of the screening coefficient β and expressed in the xyz coordinate system, when choosing 16 and 24 unit cells for the periodicity of the (in-plane) x’ and y’ directions for [110] and [111] films under compressive strain and 12 unit cells for the periodicity of the x’ and y’ directions for all other films (see text for the definition of the xyz and x’y’z’ coordinate systems). Parts (a), (b), and (c): [001] films under stress free, 2.65% tensile strain, and -2.65% compressive strain, respectively. Parts (d)-(f): same as parts (a)-(c) but for a [110] film. Parts (g)-(i): same as parts (a)-(c) but for a [111] film. The vertical lines characterize the transition of the dipoles pattern from short-circuit-like conditions to open-circuit-like conditions. The schematization of these two different patterns is given above each part. The width of the stripe domains is given in Angstrom.
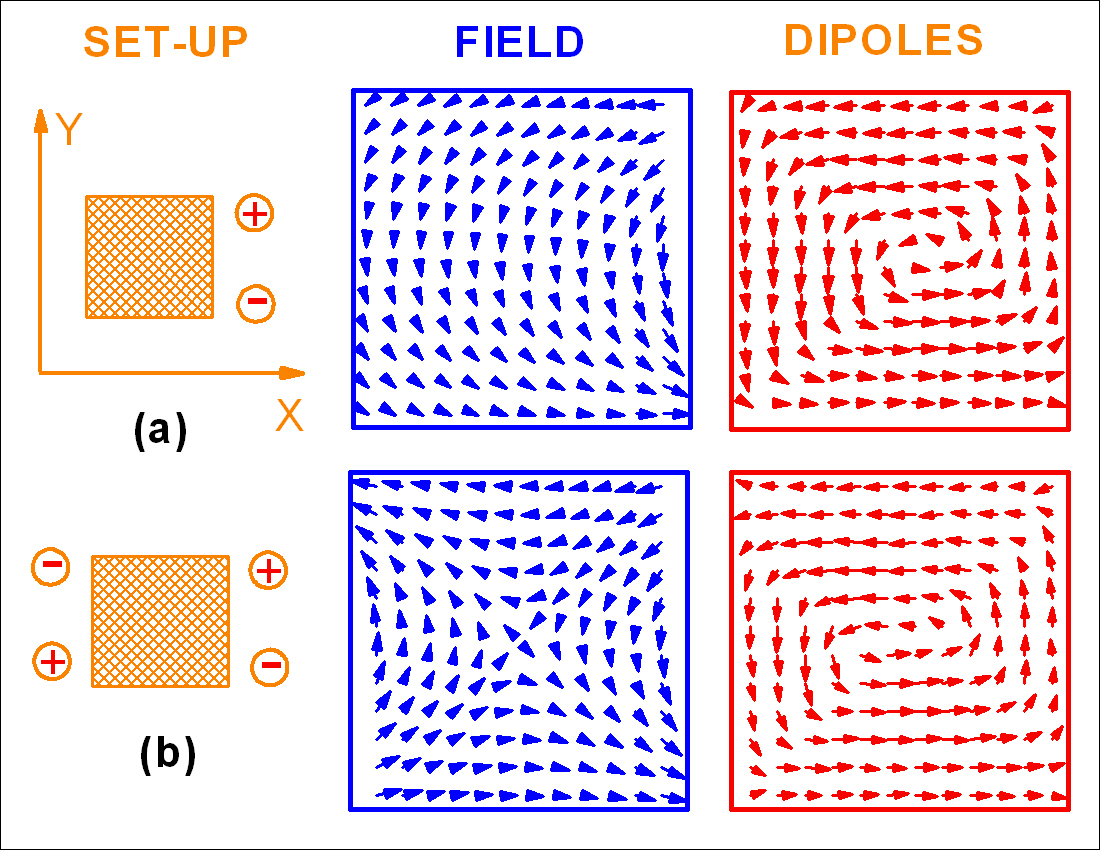
Schematization of the two set-ups considered in this study, the resulting inhomogeneous electric fields at the sites of the dot and the ground-state dipole pattern.
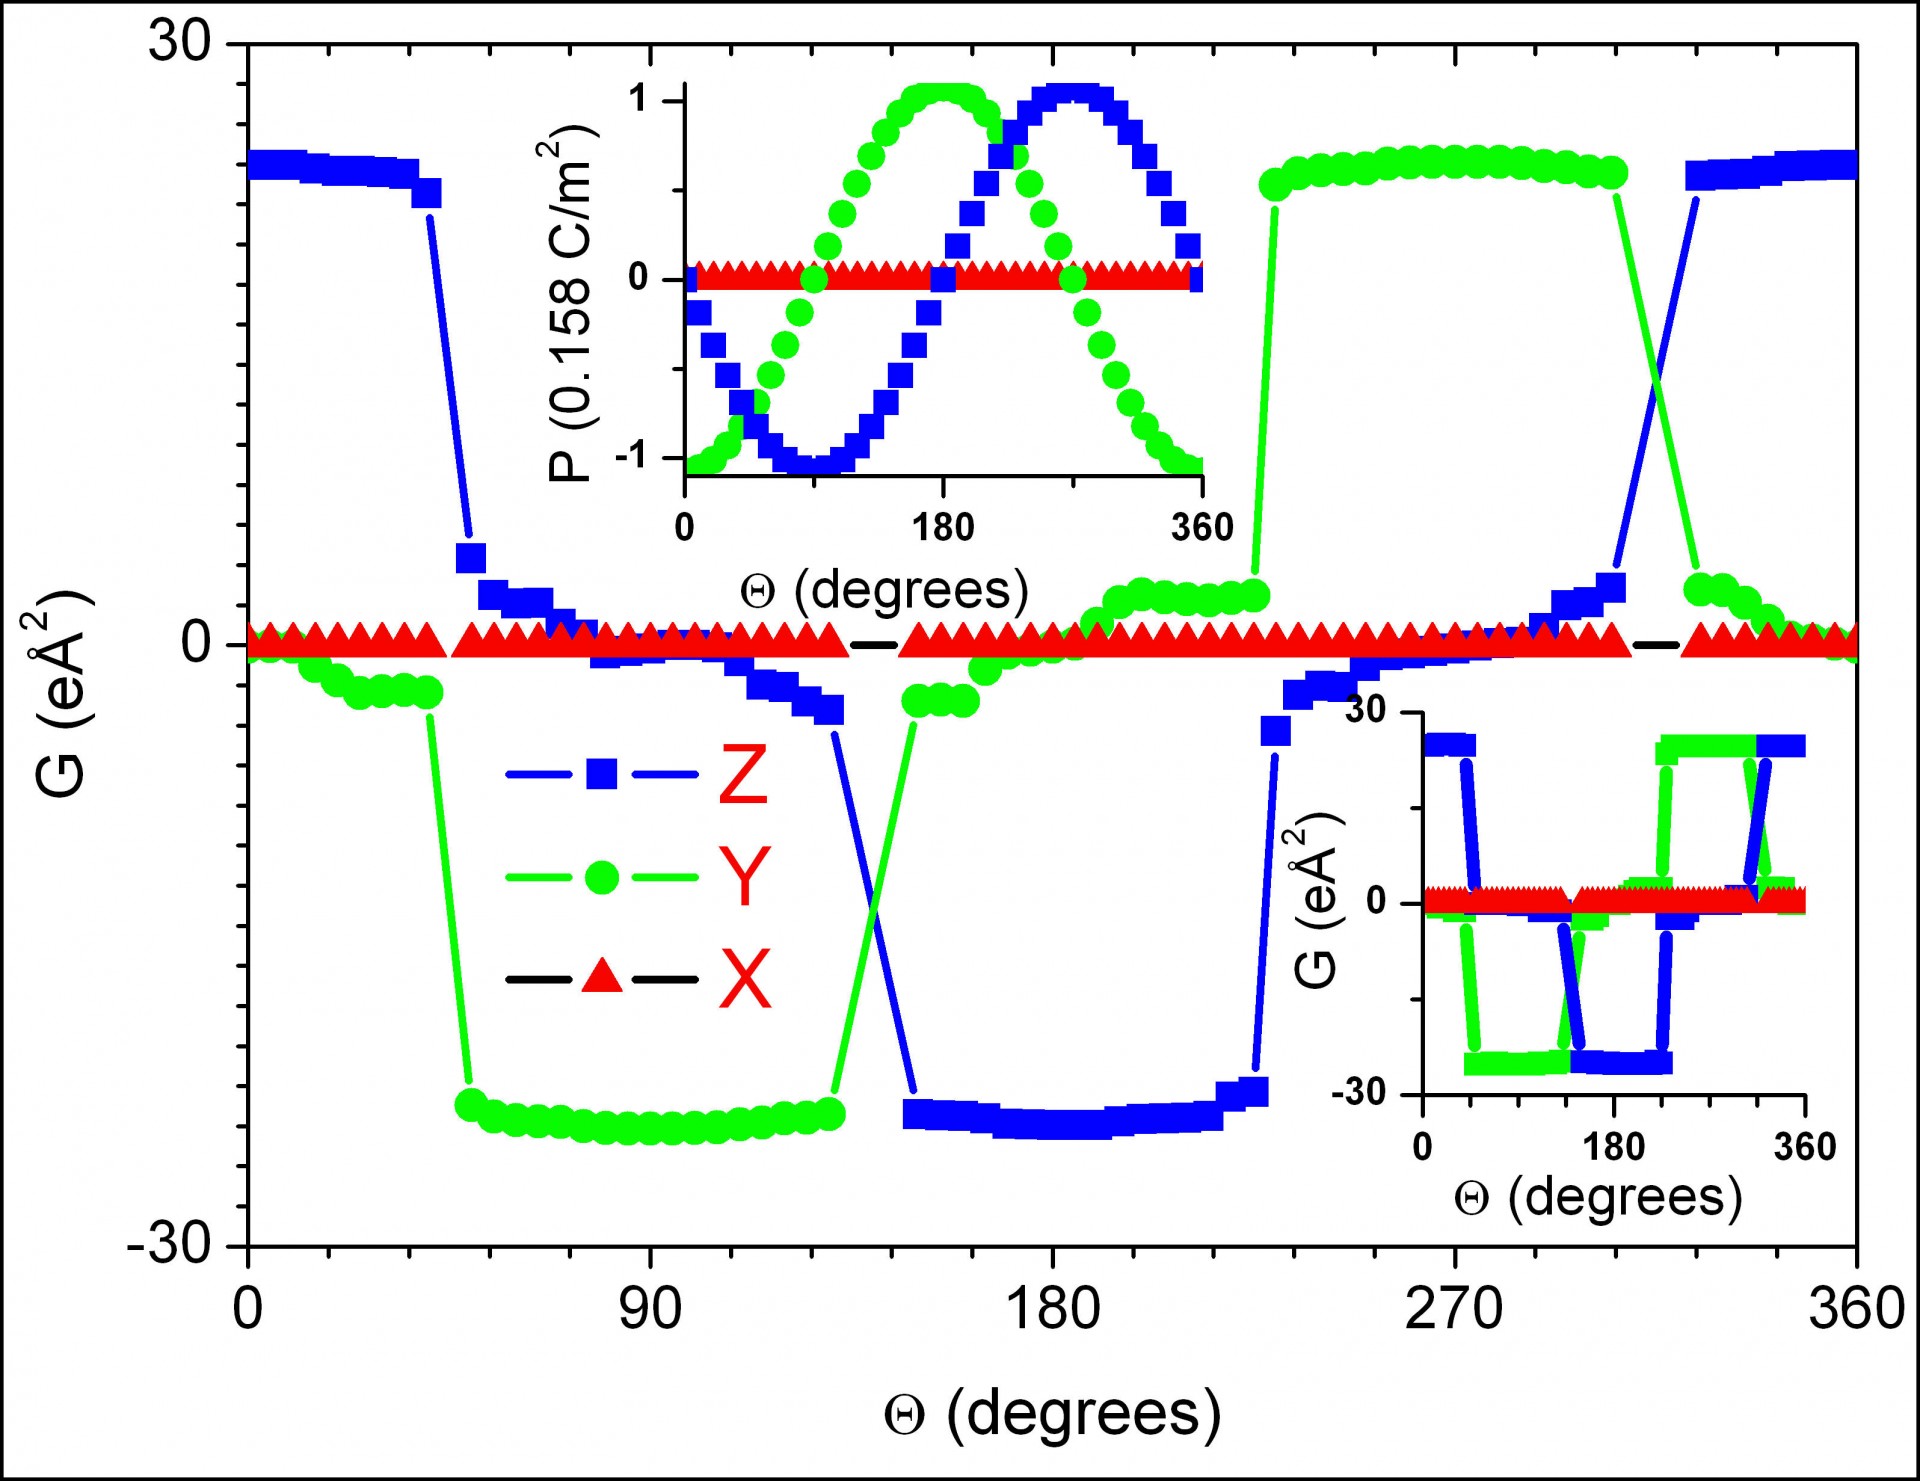
Dependency of the Cartesian components of the ground-state toroidal moment and polarization (in the top inset) on the angle of rotation about the x-axis of the dipolar source associated with the setup of Fig. (a). For each angle, the calculations are first performed at high temperature and then slowly cooled down until 1 K. The bottom inset reports the dependency of the ground-state toroidal moment for the setup of Fig. (b) (for which no polarization exists) with respect to the angle of rotation about the x-axis of the two dipolar sources.
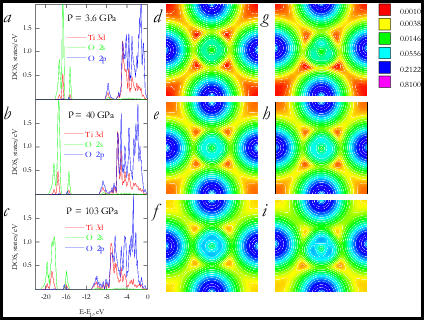
Electronic-related properties of PbTiO3under pressure. Panels (a), (b) and (c) display the partial electronic density of occupied states in the cubic phase at 3.6, 40 and 103 GPa, respectively, for the O 2s, O 2p and Ti 3d orbitals. The zero in energy is chosen at the top of the valence band. Panels (d), (e) and (f) show the electronic charge density of the valence bands located between -22 and -15 eV in the vertical (100) plane passing through Ti (center), Oparallel (top and bottom sides), and Operpend (left and right sides) atoms for the cubic state at 3.6, 40, and 103 GPa, respectively. Panels (g)-(i) display the same information as Panels (d)-(f), respectively, but for the P4mm equilibrium – for which Ti moves towards the bottom oxygen atom.
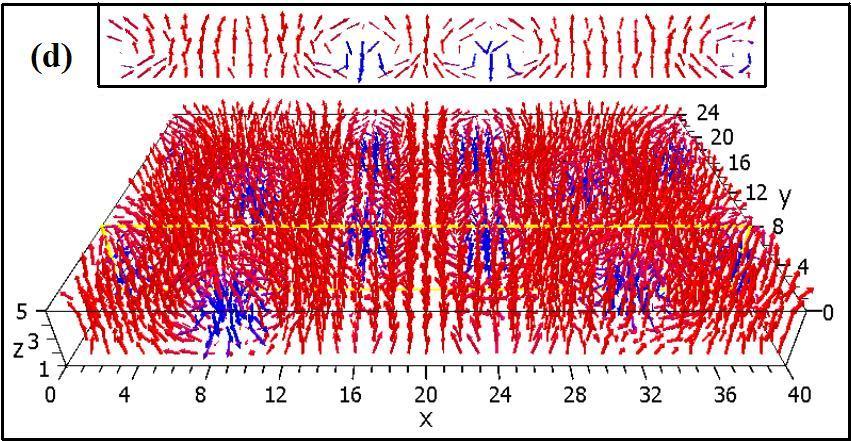
Nanobubbles in ferroelectric ultrathin films under external electric field. Yellow lines indicate plane of y=8, which cross-sectional view is shown in inset.
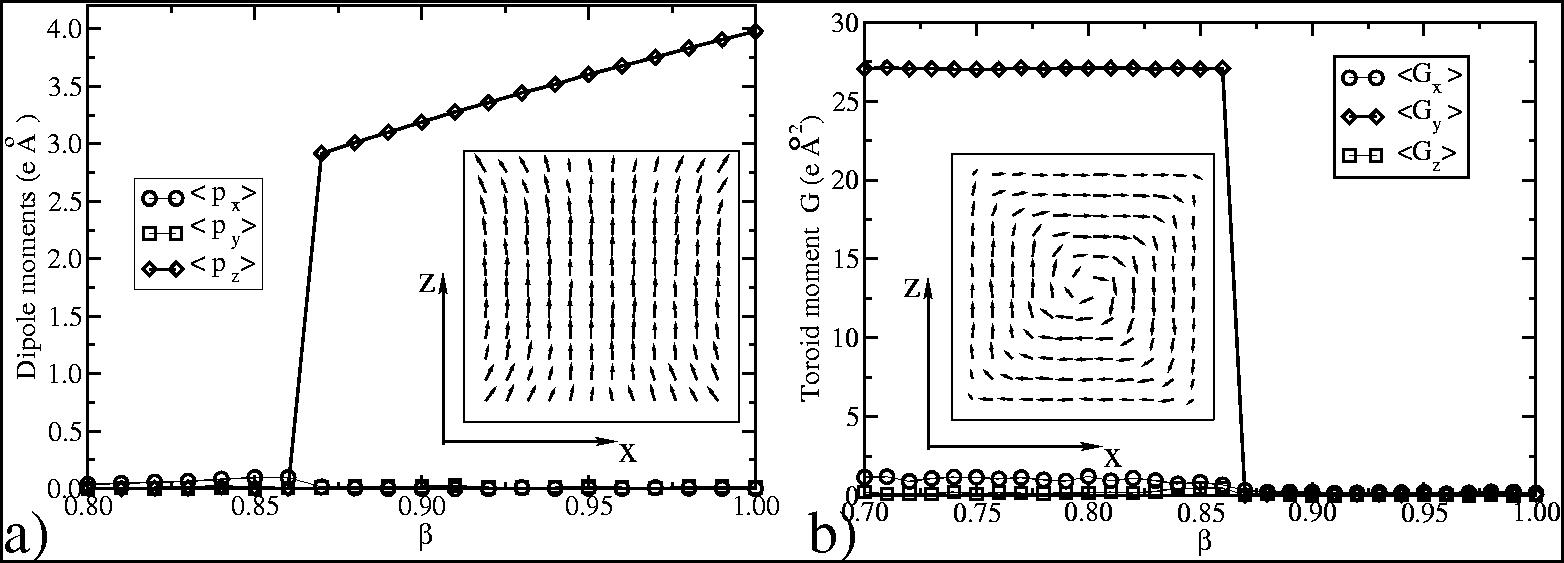
(a) Dipole moments and (b) toroid moment of polarization in a PZT nanodot as a function of the screening coefficient β. Insets of (a) and (b) show the polarization pattern for β=1 (ideal short circuit conditions) and β=0 (ideal open circuit conditions), respectively.